Immigrants from Dominican Republic vs Immigrants from Dominica Householder Income Ages 45 - 64 years
COMPARE
Immigrants from Dominican Republic
Immigrants from Dominica
Householder Income Ages 45 - 64 years
Householder Income Ages 45 - 64 years Comparison
Immigrants from Dominican Republic
Immigrants from Dominica
$78,836
HOUSEHOLDER INCOME AGES 45 - 64 YEARS
0.0/ 100
METRIC RATING
331st/ 347
METRIC RANK
$83,311
HOUSEHOLDER INCOME AGES 45 - 64 YEARS
0.0/ 100
METRIC RATING
309th/ 347
METRIC RANK
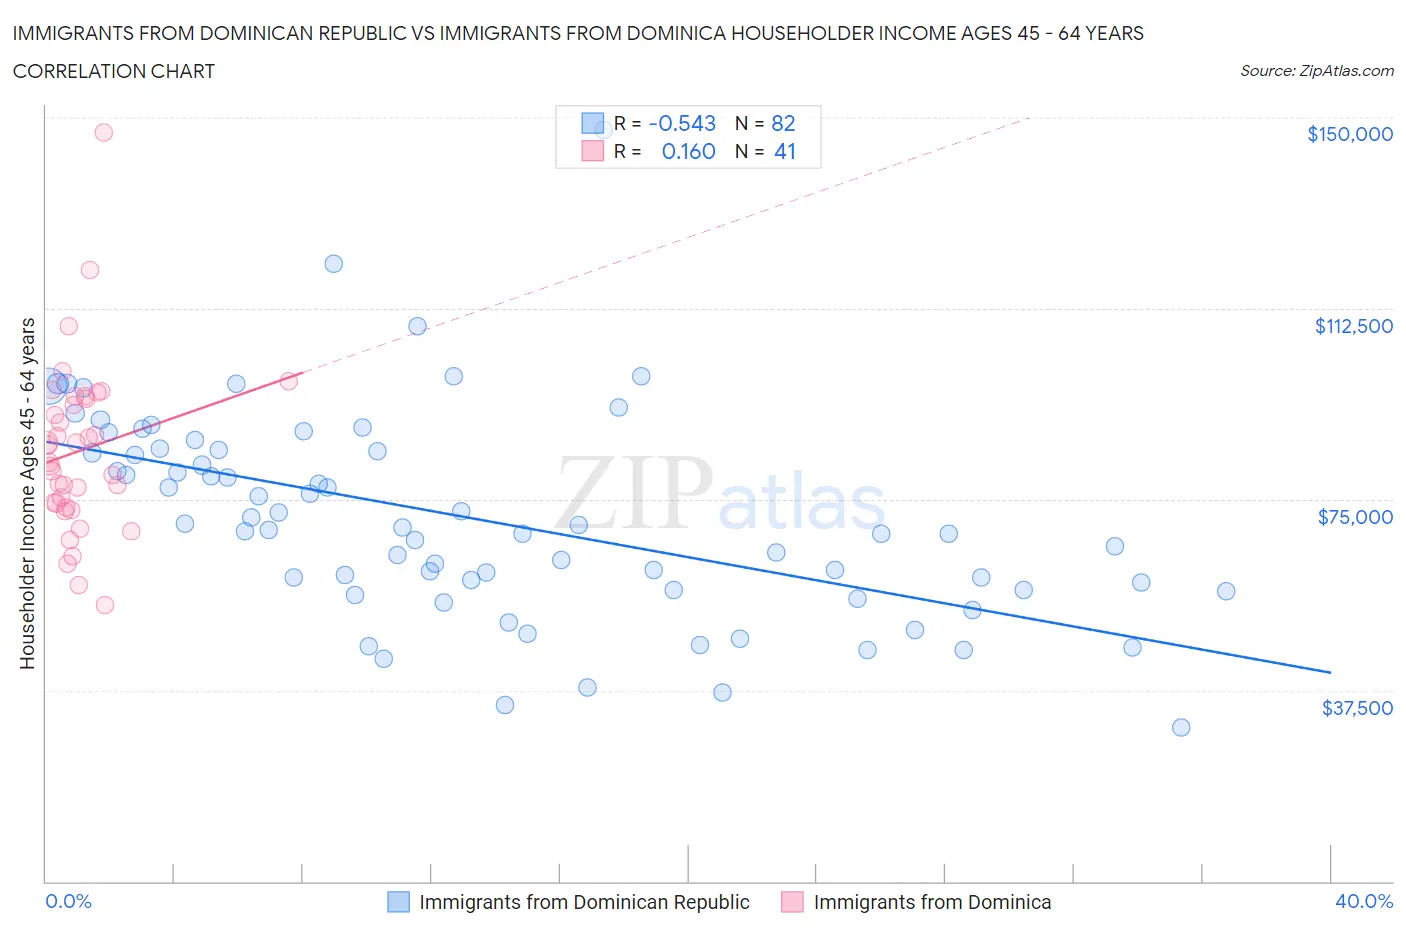
Immigrants from Dominican Republic vs Immigrants from Dominica Householder Income Ages 45 - 64 years Correlation Chart
The statistical analysis conducted on geographies consisting of 274,687,311 people shows a substantial negative correlation between the proportion of Immigrants from Dominican Republic and household income with householder between the ages 45 and 64 in the United States with a correlation coefficient (R) of -0.543 and weighted average of $78,836. Similarly, the statistical analysis conducted on geographies consisting of 83,752,820 people shows a poor positive correlation between the proportion of Immigrants from Dominica and household income with householder between the ages 45 and 64 in the United States with a correlation coefficient (R) of 0.160 and weighted average of $83,311, a difference of 5.7%.
Householder Income Ages 45 - 64 years Correlation Summary
| Measurement | Immigrants from Dominican Republic | Immigrants from Dominica |
| Minimum | $30,156 | $54,250 |
| Maximum | $147,500 | $147,083 |
| Range | $117,344 | $92,833 |
| Mean | $71,398 | $84,539 |
| Median | $69,228 | $82,174 |
| Interquartile 25% (IQ1) | $57,193 | $73,845 |
| Interquartile 75% (IQ3) | $84,653 | $95,001 |
| Interquartile Range (IQR) | $27,460 | $21,156 |
| Standard Deviation (Sample) | $20,395 | $16,874 |
| Standard Deviation (Population) | $20,271 | $16,667 |
Similar Demographics by Householder Income Ages 45 - 64 years
Demographics Similar to Immigrants from Dominican Republic by Householder Income Ages 45 - 64 years
In terms of householder income ages 45 - 64 years, the demographic groups most similar to Immigrants from Dominican Republic are Creek ($78,960, a difference of 0.16%), Black/African American ($78,556, a difference of 0.36%), Dutch West Indian ($79,171, a difference of 0.42%), Native/Alaskan ($79,816, a difference of 1.2%), and Immigrants from Congo ($77,850, a difference of 1.3%).
| Demographics | Rating | Rank | Householder Income Ages 45 - 64 years |
| Yup'ik | 0.0 /100 | #324 | Tragic $81,000 |
| Immigrants | Cuba | 0.0 /100 | #325 | Tragic $80,662 |
| Dominicans | 0.0 /100 | #326 | Tragic $80,623 |
| Seminole | 0.0 /100 | #327 | Tragic $80,077 |
| Natives/Alaskans | 0.0 /100 | #328 | Tragic $79,816 |
| Dutch West Indians | 0.0 /100 | #329 | Tragic $79,171 |
| Creek | 0.0 /100 | #330 | Tragic $78,960 |
| Immigrants | Dominican Republic | 0.0 /100 | #331 | Tragic $78,836 |
| Blacks/African Americans | 0.0 /100 | #332 | Tragic $78,556 |
| Immigrants | Congo | 0.0 /100 | #333 | Tragic $77,850 |
| Menominee | 0.0 /100 | #334 | Tragic $76,903 |
| Cheyenne | 0.0 /100 | #335 | Tragic $76,362 |
| Arapaho | 0.0 /100 | #336 | Tragic $75,945 |
| Pueblo | 0.0 /100 | #337 | Tragic $75,601 |
| Hopi | 0.0 /100 | #338 | Tragic $75,562 |
Demographics Similar to Immigrants from Dominica by Householder Income Ages 45 - 64 years
In terms of householder income ages 45 - 64 years, the demographic groups most similar to Immigrants from Dominica are Immigrants from Haiti ($83,257, a difference of 0.060%), Immigrants from Bahamas ($83,177, a difference of 0.16%), Immigrants from Cabo Verde ($83,542, a difference of 0.28%), Shoshone ($83,588, a difference of 0.33%), and Cajun ($83,015, a difference of 0.36%).
| Demographics | Rating | Rank | Householder Income Ages 45 - 64 years |
| Haitians | 0.0 /100 | #302 | Tragic $84,384 |
| Hondurans | 0.0 /100 | #303 | Tragic $84,079 |
| Ottawa | 0.0 /100 | #304 | Tragic $83,953 |
| Chippewa | 0.0 /100 | #305 | Tragic $83,943 |
| Ute | 0.0 /100 | #306 | Tragic $83,937 |
| Shoshone | 0.0 /100 | #307 | Tragic $83,588 |
| Immigrants | Cabo Verde | 0.0 /100 | #308 | Tragic $83,542 |
| Immigrants | Dominica | 0.0 /100 | #309 | Tragic $83,311 |
| Immigrants | Haiti | 0.0 /100 | #310 | Tragic $83,257 |
| Immigrants | Bahamas | 0.0 /100 | #311 | Tragic $83,177 |
| Cajuns | 0.0 /100 | #312 | Tragic $83,015 |
| U.S. Virgin Islanders | 0.0 /100 | #313 | Tragic $82,736 |
| Immigrants | Honduras | 0.0 /100 | #314 | Tragic $82,697 |
| Paiute | 0.0 /100 | #315 | Tragic $82,629 |
| Immigrants | Caribbean | 0.0 /100 | #316 | Tragic $82,513 |