Immigrants from Dominican Republic vs Immigrants from Moldova Householder Income Ages 45 - 64 years
COMPARE
Immigrants from Dominican Republic
Immigrants from Moldova
Householder Income Ages 45 - 64 years
Householder Income Ages 45 - 64 years Comparison
Immigrants from Dominican Republic
Immigrants from Moldova
$78,836
HOUSEHOLDER INCOME AGES 45 - 64 YEARS
0.0/ 100
METRIC RATING
331st/ 347
METRIC RANK
$107,357
HOUSEHOLDER INCOME AGES 45 - 64 YEARS
97.1/ 100
METRIC RATING
102nd/ 347
METRIC RANK
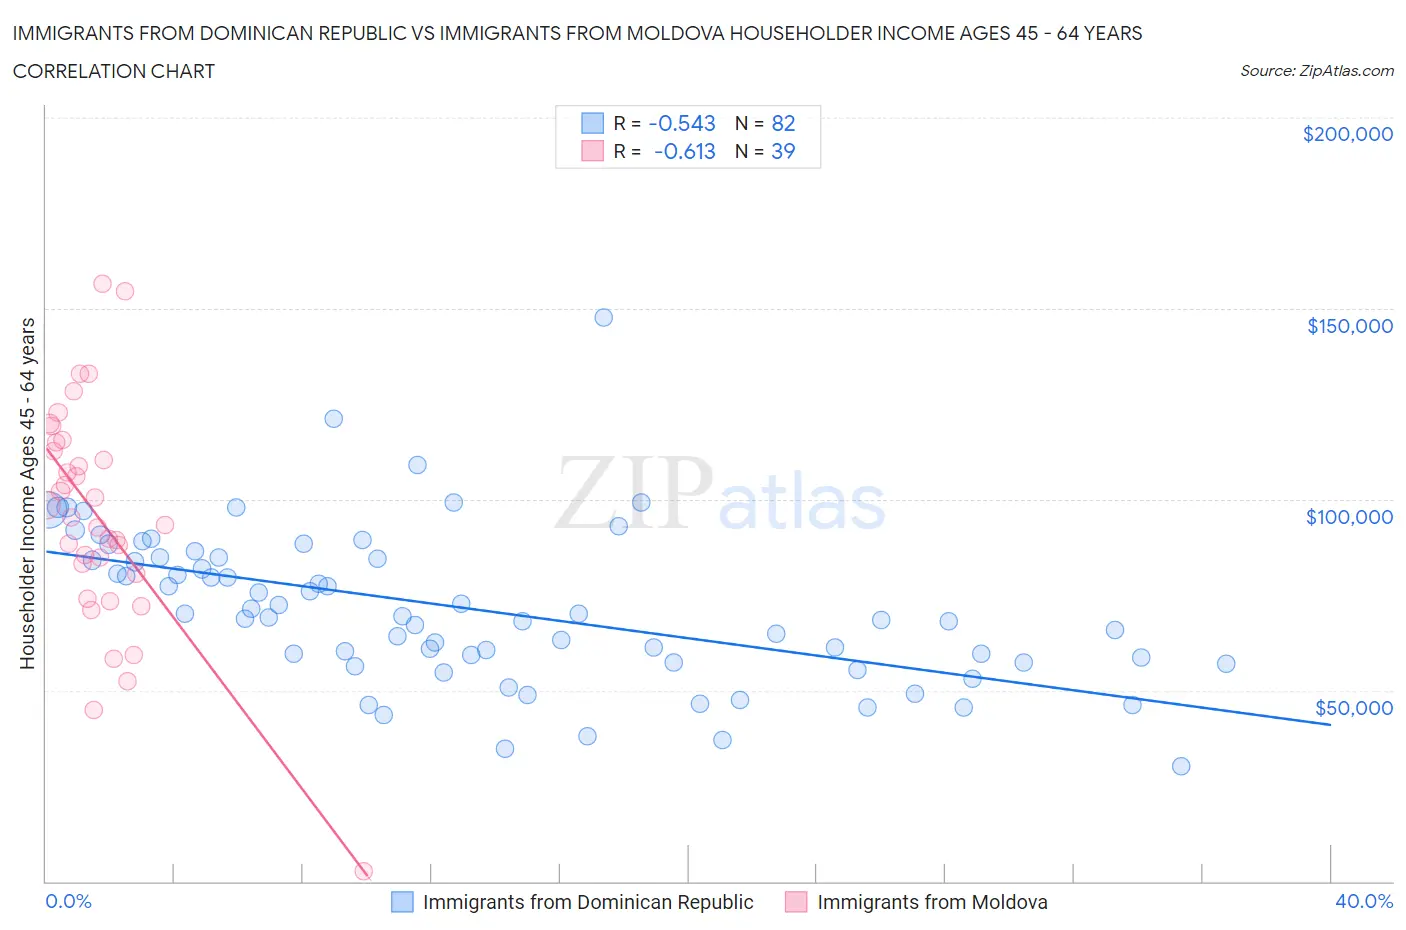
Immigrants from Dominican Republic vs Immigrants from Moldova Householder Income Ages 45 - 64 years Correlation Chart
The statistical analysis conducted on geographies consisting of 274,687,311 people shows a substantial negative correlation between the proportion of Immigrants from Dominican Republic and household income with householder between the ages 45 and 64 in the United States with a correlation coefficient (R) of -0.543 and weighted average of $78,836. Similarly, the statistical analysis conducted on geographies consisting of 124,350,842 people shows a significant negative correlation between the proportion of Immigrants from Moldova and household income with householder between the ages 45 and 64 in the United States with a correlation coefficient (R) of -0.613 and weighted average of $107,357, a difference of 36.2%.
Householder Income Ages 45 - 64 years Correlation Summary
| Measurement | Immigrants from Dominican Republic | Immigrants from Moldova |
| Minimum | $30,156 | $2,499 |
| Maximum | $147,500 | $156,555 |
| Range | $117,344 | $154,056 |
| Mean | $71,398 | $95,532 |
| Median | $69,228 | $95,372 |
| Interquartile 25% (IQ1) | $57,193 | $80,570 |
| Interquartile 75% (IQ3) | $84,653 | $114,888 |
| Interquartile Range (IQR) | $27,460 | $34,318 |
| Standard Deviation (Sample) | $20,395 | $29,698 |
| Standard Deviation (Population) | $20,271 | $29,315 |
Similar Demographics by Householder Income Ages 45 - 64 years
Demographics Similar to Immigrants from Dominican Republic by Householder Income Ages 45 - 64 years
In terms of householder income ages 45 - 64 years, the demographic groups most similar to Immigrants from Dominican Republic are Creek ($78,960, a difference of 0.16%), Black/African American ($78,556, a difference of 0.36%), Dutch West Indian ($79,171, a difference of 0.42%), Native/Alaskan ($79,816, a difference of 1.2%), and Immigrants from Congo ($77,850, a difference of 1.3%).
| Demographics | Rating | Rank | Householder Income Ages 45 - 64 years |
| Yup'ik | 0.0 /100 | #324 | Tragic $81,000 |
| Immigrants | Cuba | 0.0 /100 | #325 | Tragic $80,662 |
| Dominicans | 0.0 /100 | #326 | Tragic $80,623 |
| Seminole | 0.0 /100 | #327 | Tragic $80,077 |
| Natives/Alaskans | 0.0 /100 | #328 | Tragic $79,816 |
| Dutch West Indians | 0.0 /100 | #329 | Tragic $79,171 |
| Creek | 0.0 /100 | #330 | Tragic $78,960 |
| Immigrants | Dominican Republic | 0.0 /100 | #331 | Tragic $78,836 |
| Blacks/African Americans | 0.0 /100 | #332 | Tragic $78,556 |
| Immigrants | Congo | 0.0 /100 | #333 | Tragic $77,850 |
| Menominee | 0.0 /100 | #334 | Tragic $76,903 |
| Cheyenne | 0.0 /100 | #335 | Tragic $76,362 |
| Arapaho | 0.0 /100 | #336 | Tragic $75,945 |
| Pueblo | 0.0 /100 | #337 | Tragic $75,601 |
| Hopi | 0.0 /100 | #338 | Tragic $75,562 |
Demographics Similar to Immigrants from Moldova by Householder Income Ages 45 - 64 years
In terms of householder income ages 45 - 64 years, the demographic groups most similar to Immigrants from Moldova are Immigrants from Kazakhstan ($107,378, a difference of 0.020%), Syrian ($107,207, a difference of 0.14%), Immigrants from Serbia ($107,569, a difference of 0.20%), Immigrants from Ukraine ($107,079, a difference of 0.26%), and Macedonian ($107,074, a difference of 0.26%).
| Demographics | Rating | Rank | Householder Income Ages 45 - 64 years |
| Immigrants | Hungary | 98.2 /100 | #95 | Exceptional $108,267 |
| Immigrants | Argentina | 98.2 /100 | #96 | Exceptional $108,264 |
| Northern Europeans | 97.8 /100 | #97 | Exceptional $107,870 |
| Immigrants | Southern Europe | 97.7 /100 | #98 | Exceptional $107,775 |
| Palestinians | 97.6 /100 | #99 | Exceptional $107,721 |
| Immigrants | Serbia | 97.4 /100 | #100 | Exceptional $107,569 |
| Immigrants | Kazakhstan | 97.2 /100 | #101 | Exceptional $107,378 |
| Immigrants | Moldova | 97.1 /100 | #102 | Exceptional $107,357 |
| Syrians | 96.9 /100 | #103 | Exceptional $107,207 |
| Immigrants | Ukraine | 96.7 /100 | #104 | Exceptional $107,079 |
| Macedonians | 96.7 /100 | #105 | Exceptional $107,074 |
| Armenians | 96.6 /100 | #106 | Exceptional $107,002 |
| Immigrants | Fiji | 96.5 /100 | #107 | Exceptional $106,952 |
| Zimbabweans | 96.3 /100 | #108 | Exceptional $106,849 |
| Chileans | 95.9 /100 | #109 | Exceptional $106,611 |