Barbadian vs Thai Householder Income Ages 45 - 64 years

COMPARE

Barbadian
Race
Ancestry
AfghanAfricanAlaska NativeAlaskan AthabascanAlbanianAleutAlsatianAmericanApacheArabArapahoArgentineanArmenianAssyrian/Chaldean/SyriacAustralianAustrianBahamianBangladeshiBarbadianBasqueBelgianBelizeanBermudanBhutaneseBlackfeetBolivianBrazilianBritishBritish West IndianBulgarianBurmeseCajunCambodianCanadianCape VerdeanCarpatho RusynCelticCentral AmericanCentral American IndianCherokeeCheyenneChickasawChileanChineseChippewaChoctawColombianColvilleComancheCosta RicanCreeCreekCroatianCrowCubanCypriotCzechCzechoslovakianDanishDelawareDominicanDutchDutch West IndianEastern EuropeanEcuadorianEgyptianEnglishEstonianEthiopianEuropeanFijianFilipinoFinnishFrenchFrench American IndianFrench CanadianGermanGerman RussianGhanaianGreekGuamanian/ChamorroGuatemalanGuyaneseHaitianHmongHonduranHopiHoumaHungarianIcelanderIndian (Asian)IndonesianInupiatIranianIraqiIrishIroquoisIsraeliItalianJamaicanJapaneseJordanianKenyanKiowaKoreanLaotianLatvianLebaneseLiberianLithuanianLumbeeLuxembourgerMacedonianMalaysianMalteseMarshalleseMenomineeMexicanMexican American IndianMongolianMoroccanNative HawaiianNavajoNepaleseNew ZealanderNicaraguanNigerianNorthern EuropeanNorwegianOkinawanOsageOttawaPaiutePakistaniPalestinianPanamanianParaguayanPennsylvania GermanPeruvianPimaPolishPortuguesePotawatomiPuebloPuerto RicanPuget Sound SalishRomanianRussianSalvadoranSamoanScandinavianScotch-IrishScottishSeminoleSenegaleseSerbianShoshoneSierra LeoneanSiouxSlavicSlovakSloveneSomaliSouth AfricanSouth AmericanSouth American IndianSoviet UnionSpaniardSpanishSpanish AmericanSpanish American IndianSri LankanSubsaharan AfricanSudaneseSwedishSwissSyrianTaiwaneseTlingit-HaidaTohono O'OdhamTonganTrinidadian and TobagonianTsimshianTurkishU.S. Virgin IslanderUgandanUkrainianUruguayanUteVenezuelanVietnameseWelshWest IndianYakamaYaquiYugoslavianYumanYup'ikZimbabwean
Immigration
NonimmigrantsImmigrantsAfghanistanAfricaAlbaniaArgentinaArmeniaAsiaAustraliaAustriaBahamasBangladeshBarbadosBelarusBelgiumBelizeBoliviaBosnia and HerzegovinaBrazilBulgariaBurma/MyanmarCabo VerdeCambodiaCameroonCanadaCaribbeanCentral AmericaChileChinaColombiaCongoCosta RicaCroatiaCubaCzechoslovakiaDenmarkDominicaDominican RepublicEastern AfricaEastern AsiaEastern EuropeEcuadorEgyptEl SalvadorEnglandEritreaEthiopiaEuropeFijiFranceGermanyGhanaGreeceGrenadaGuatemalaGuyanaHaitiHondurasHong KongHungaryIndiaIndonesiaIranIraqIrelandIsraelItalyJamaicaJapanJordanKazakhstanKenyaKoreaKuwaitLaosLatin AmericaLatviaLebanonLiberiaLithuaniaMalaysiaMexicoMicronesiaMiddle AfricaMoldovaMoroccoNepalNetherlandsNicaraguaNigeriaNorth AmericaNorth MacedoniaNorthern AfricaNorthern EuropeNorwayOceaniaPakistanPanamaPeruPhilippinesPolandPortugalRomaniaRussiaSaudi ArabiaScotlandSenegalSerbiaSierra LeoneSingaporeSomaliaSouth AfricaSouth AmericaSouth Central AsiaSouth Eastern AsiaSouthern EuropeSpainSri LankaSt. Vincent and the GrenadinesSudanSwedenSwitzerlandSyriaTaiwanThailandTrinidad and TobagoTurkeyUgandaUkraineUruguayUzbekistanVenezuelaVietnamWest IndiesWestern AfricaWestern AsiaWestern EuropeYemenZaireZimbabweAzores
Thai
Race
Ancestry
AfghanAfricanAlaska NativeAlaskan AthabascanAlbanianAleutAlsatianAmericanApacheArabArapahoArgentineanArmenianAssyrian/Chaldean/SyriacAustralianAustrianBahamianBangladeshiBasqueBelgianBelizeanBermudanBhutaneseBlackfeetBolivianBrazilianBritishBritish West IndianBulgarianBurmeseCajunCambodianCanadianCape VerdeanCarpatho RusynCelticCentral AmericanCentral American IndianCherokeeCheyenneChickasawChileanChineseChippewaChoctawColombianColvilleComancheCosta RicanCreeCreekCroatianCrowCubanCypriotCzechCzechoslovakianDanishDelawareDominicanDutchDutch West IndianEastern EuropeanEcuadorianEgyptianEnglishEstonianEthiopianEuropeanFijianFilipinoFinnishFrenchFrench American IndianFrench CanadianGermanGerman RussianGhanaianGreekGuamanian/ChamorroGuatemalanGuyaneseHaitianHmongHonduranHopiHoumaHungarianIcelanderIndian (Asian)IndonesianInupiatIranianIraqiIrishIroquoisIsraeliItalianJamaicanJapaneseJordanianKenyanKiowaKoreanLaotianLatvianLebaneseLiberianLithuanianLumbeeLuxembourgerMacedonianMalaysianMalteseMarshalleseMenomineeMexicanMexican American IndianMongolianMoroccanNative HawaiianNavajoNepaleseNew ZealanderNicaraguanNigerianNorthern EuropeanNorwegianOkinawanOsageOttawaPaiutePakistaniPalestinianPanamanianParaguayanPennsylvania GermanPeruvianPimaPolishPortuguesePotawatomiPuebloPuerto RicanPuget Sound SalishRomanianRussianSalvadoranSamoanScandinavianScotch-IrishScottishSeminoleSenegaleseSerbianShoshoneSierra LeoneanSiouxSlavicSlovakSloveneSomaliSouth AfricanSouth AmericanSouth American IndianSoviet UnionSpaniardSpanishSpanish AmericanSpanish American IndianSri LankanSubsaharan AfricanSudaneseSwedishSwissSyrianTaiwaneseThaiTlingit-HaidaTohono O'OdhamTonganTrinidadian and TobagonianTsimshianTurkishU.S. Virgin IslanderUgandanUkrainianUruguayanUteVenezuelanVietnameseWelshWest IndianYakamaYaquiYugoslavianYumanYup'ikZimbabwean
Immigration
NonimmigrantsImmigrantsAfghanistanAfricaAlbaniaArgentinaArmeniaAsiaAustraliaAustriaBahamasBangladeshBarbadosBelarusBelgiumBelizeBoliviaBosnia and HerzegovinaBrazilBulgariaBurma/MyanmarCabo VerdeCambodiaCameroonCanadaCaribbeanCentral AmericaChileChinaColombiaCongoCosta RicaCroatiaCubaCzechoslovakiaDenmarkDominicaDominican RepublicEastern AfricaEastern AsiaEastern EuropeEcuadorEgyptEl SalvadorEnglandEritreaEthiopiaEuropeFijiFranceGermanyGhanaGreeceGrenadaGuatemalaGuyanaHaitiHondurasHong KongHungaryIndiaIndonesiaIranIraqIrelandIsraelItalyJamaicaJapanJordanKazakhstanKenyaKoreaKuwaitLaosLatin AmericaLatviaLebanonLiberiaLithuaniaMalaysiaMexicoMicronesiaMiddle AfricaMoldovaMoroccoNepalNetherlandsNicaraguaNigeriaNorth AmericaNorth MacedoniaNorthern AfricaNorthern EuropeNorwayOceaniaPakistanPanamaPeruPhilippinesPolandPortugalRomaniaRussiaSaudi ArabiaScotlandSenegalSerbiaSierra LeoneSingaporeSomaliaSouth AfricaSouth AmericaSouth Central AsiaSouth Eastern AsiaSouthern EuropeSpainSri LankaSt. Vincent and the GrenadinesSudanSwedenSwitzerlandSyriaTaiwanThailandTrinidad and TobagoTurkeyUgandaUkraineUruguayUzbekistanVenezuelaVietnamWest IndiesWestern AfricaWestern AsiaWestern EuropeYemenZaireZimbabweAzores
Householder Income Ages 45 - 64 years
Income
Poverty
Unemployment
Labor Participation
Family Structure
Vehicle Availability
Education Level
Disability

Householder Income Ages 45 - 64 years Comparison

Barbadians

Thais

Tragic
Exceptional
$90,266
HOUSEHOLDER INCOME AGES 45 - 64 YEARS
0.6/ 100
METRIC RATING
253rd/ 347
METRIC RANK
$129,560
HOUSEHOLDER INCOME AGES 45 - 64 YEARS
100.0/ 100
METRIC RATING
4th/ 347
METRIC RANK

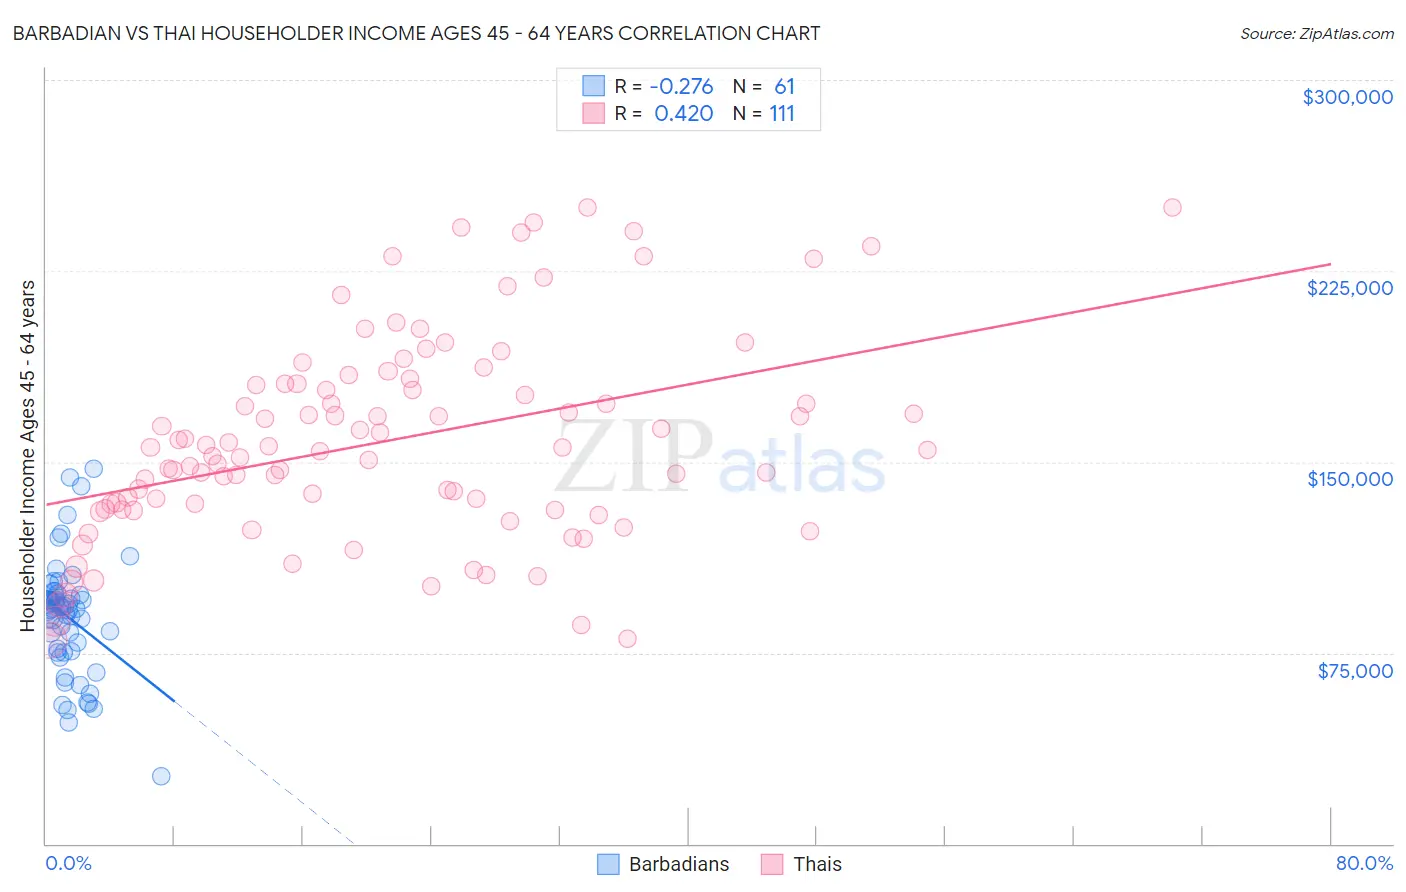
Barbadian vs Thai Householder Income Ages 45 - 64 years Correlation Chart

The statistical analysis conducted on geographies consisting of 141,200,649 people shows a weak negative correlation between the proportion of Barbadians and household income with householder between the ages 45 and 64 in the United States with a correlation coefficient (R) of -0.276 and weighted average of $90,266. Similarly, the statistical analysis conducted on geographies consisting of 474,584,420 people shows a moderate positive correlation between the proportion of Thais and household income with householder between the ages 45 and 64 in the United States with a correlation coefficient (R) of 0.420 and weighted average of $129,560, a difference of 43.5%.
Barbadian vs Thai Householder Income Ages 45 - 64 years

Householder Income Ages 45 - 64 years Correlation Summary

MeasurementBarbadianThai
Minimum$26,458$80,277
Maximum$147,517$250,001
Range$121,059$169,724
Mean$88,874$158,060
Median$92,167$154,550
Interquartile 25% (IQ1)$75,253$131,303
Interquartile 75% (IQ3)$97,931$180,581
Interquartile Range (IQR)$22,678$49,278
Standard Deviation (Sample)$22,976$39,812
Standard Deviation (Population)$22,787$39,632

Similar Demographics by Householder Income Ages 45 - 64 years

Demographics Similar to Barbadians by Householder Income Ages 45 - 64 years

In terms of householder income ages 45 - 64 years, the demographic groups most similar to Barbadians are Immigrants from Guyana ($90,186, a difference of 0.090%), Marshallese ($90,455, a difference of 0.21%), American ($90,536, a difference of 0.30%), West Indian ($89,906, a difference of 0.40%), and Subsaharan African ($90,691, a difference of 0.47%).
DemographicsRating | RankHouseholder Income Ages 45 - 64 years
Central Americans
0.9
/100
|
#246
Tragic
$90,951
Alaskan Athabascans
0.9
/100
|
#247
Tragic
$90,951
Immigrants | Laos
0.9
/100
|
#248
Tragic
$90,909
Mexican American Indians
0.8
/100
|
#249
Tragic
$90,811
Sub-Saharan Africans
0.8
/100
|
#250
Tragic
$90,691
Americans
0.7
/100
|
#251
Tragic
$90,536
Marshallese
0.7
/100
|
#252
Tragic
$90,455
Barbadians
0.6
/100
|
#253
Tragic
$90,266
Immigrants | Guyana
0.6
/100
|
#254
Tragic
$90,186
West Indians
0.5
/100
|
#255
Tragic
$89,906
French American Indians
0.5
/100
|
#256
Tragic
$89,811
German Russians
0.4
/100
|
#257
Tragic
$89,398
Immigrants | Barbados
0.4
/100
|
#258
Tragic
$89,394
Immigrants | Nicaragua
0.4
/100
|
#259
Tragic
$89,108
Liberians
0.3
/100
|
#260
Tragic
$88,929

Demographics Similar to Thais by Householder Income Ages 45 - 64 years

In terms of householder income ages 45 - 64 years, the demographic groups most similar to Thais are Immigrants from Singapore ($129,514, a difference of 0.040%), Iranian ($129,350, a difference of 0.16%), Immigrants from Hong Kong ($127,500, a difference of 1.6%), Immigrants from Iran ($126,940, a difference of 2.1%), and Immigrants from India ($132,488, a difference of 2.3%).
DemographicsRating | RankHouseholder Income Ages 45 - 64 years
Immigrants | Taiwan
100.0
/100
|
#1
Exceptional
$135,508
Filipinos
100.0
/100
|
#2
Exceptional
$134,910
Immigrants | India
100.0
/100
|
#3
Exceptional
$132,488
Thais
100.0
/100
|
#4
Exceptional
$129,560
Immigrants | Singapore
100.0
/100
|
#5
Exceptional
$129,514
Iranians
100.0
/100
|
#6
Exceptional
$129,350
Immigrants | Hong Kong
100.0
/100
|
#7
Exceptional
$127,500
Immigrants | Iran
100.0
/100
|
#8
Exceptional
$126,940
Okinawans
100.0
/100
|
#9
Exceptional
$124,796
Immigrants | South Central Asia
100.0
/100
|
#10
Exceptional
$124,188
Cypriots
100.0
/100
|
#11
Exceptional
$123,396
Immigrants | Israel
100.0
/100
|
#12
Exceptional
$122,893
Immigrants | Ireland
100.0
/100
|
#13
Exceptional
$122,757
Indians (Asian)
100.0
/100
|
#14
Exceptional
$122,343
Immigrants | Eastern Asia
100.0
/100
|
#15
Exceptional
$122,222