Immigrants from Ukraine vs Immigrants from Western Asia Householder Income Ages 45 - 64 years
COMPARE
Immigrants from Ukraine
Immigrants from Western Asia
Householder Income Ages 45 - 64 years
Householder Income Ages 45 - 64 years Comparison
Immigrants from Ukraine
Immigrants from Western Asia
$107,079
HOUSEHOLDER INCOME AGES 45 - 64 YEARS
96.7/ 100
METRIC RATING
104th/ 347
METRIC RANK
$106,217
HOUSEHOLDER INCOME AGES 45 - 64 YEARS
95.0/ 100
METRIC RATING
118th/ 347
METRIC RANK
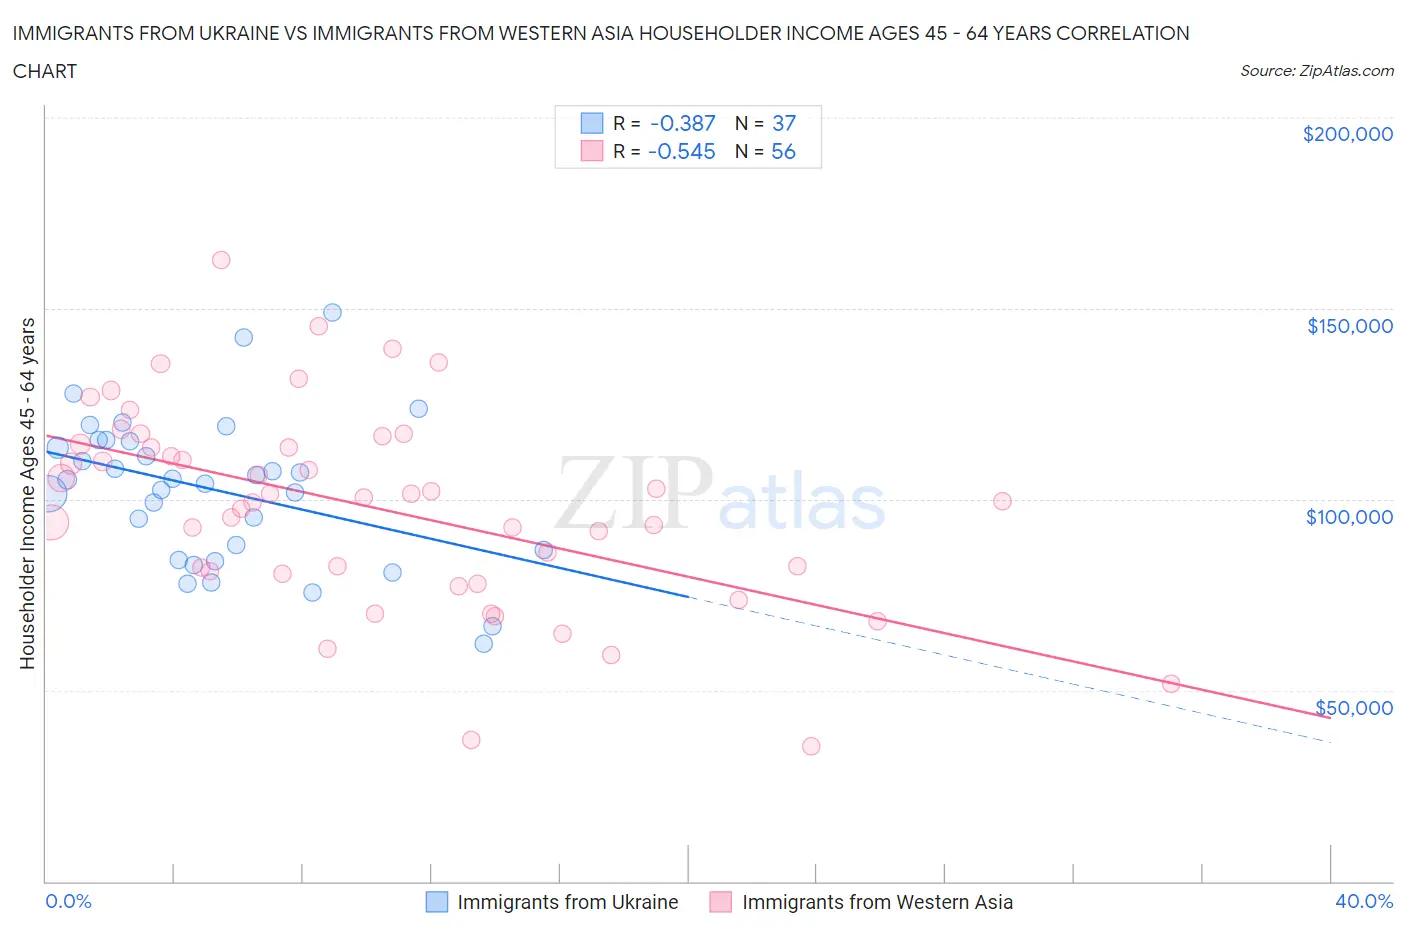
Immigrants from Ukraine vs Immigrants from Western Asia Householder Income Ages 45 - 64 years Correlation Chart
The statistical analysis conducted on geographies consisting of 289,443,409 people shows a mild negative correlation between the proportion of Immigrants from Ukraine and household income with householder between the ages 45 and 64 in the United States with a correlation coefficient (R) of -0.387 and weighted average of $107,079. Similarly, the statistical analysis conducted on geographies consisting of 403,788,110 people shows a substantial negative correlation between the proportion of Immigrants from Western Asia and household income with householder between the ages 45 and 64 in the United States with a correlation coefficient (R) of -0.545 and weighted average of $106,217, a difference of 0.81%.
Householder Income Ages 45 - 64 years Correlation Summary
| Measurement | Immigrants from Ukraine | Immigrants from Western Asia |
| Minimum | $62,178 | $35,250 |
| Maximum | $148,942 | $162,741 |
| Range | $86,764 | $127,491 |
| Mean | $102,397 | $97,778 |
| Median | $105,174 | $100,060 |
| Interquartile 25% (IQ1) | $85,429 | $80,918 |
| Interquartile 75% (IQ3) | $115,436 | $113,930 |
| Interquartile Range (IQR) | $30,007 | $33,012 |
| Standard Deviation (Sample) | $19,369 | $26,213 |
| Standard Deviation (Population) | $19,105 | $25,977 |
Demographics Similar to Immigrants from Ukraine and Immigrants from Western Asia by Householder Income Ages 45 - 64 years
In terms of householder income ages 45 - 64 years, the demographic groups most similar to Immigrants from Ukraine are Macedonian ($107,074, a difference of 0.0%), Armenian ($107,002, a difference of 0.070%), Syrian ($107,207, a difference of 0.12%), Immigrants from Fiji ($106,952, a difference of 0.12%), and Zimbabwean ($106,849, a difference of 0.22%). Similarly, the demographic groups most similar to Immigrants from Western Asia are Albanian ($106,243, a difference of 0.020%), British ($106,264, a difference of 0.040%), Immigrants from Jordan ($106,164, a difference of 0.050%), Immigrants from Kuwait ($106,285, a difference of 0.060%), and Immigrants from Poland ($106,319, a difference of 0.10%).
| Demographics | Rating | Rank | Householder Income Ages 45 - 64 years |
| Immigrants | Kazakhstan | 97.2 /100 | #101 | Exceptional $107,378 |
| Immigrants | Moldova | 97.1 /100 | #102 | Exceptional $107,357 |
| Syrians | 96.9 /100 | #103 | Exceptional $107,207 |
| Immigrants | Ukraine | 96.7 /100 | #104 | Exceptional $107,079 |
| Macedonians | 96.7 /100 | #105 | Exceptional $107,074 |
| Armenians | 96.6 /100 | #106 | Exceptional $107,002 |
| Immigrants | Fiji | 96.5 /100 | #107 | Exceptional $106,952 |
| Zimbabweans | 96.3 /100 | #108 | Exceptional $106,849 |
| Chileans | 95.9 /100 | #109 | Exceptional $106,611 |
| Immigrants | Brazil | 95.6 /100 | #110 | Exceptional $106,470 |
| Immigrants | Vietnam | 95.5 /100 | #111 | Exceptional $106,417 |
| Swedes | 95.4 /100 | #112 | Exceptional $106,377 |
| Europeans | 95.4 /100 | #113 | Exceptional $106,367 |
| Immigrants | Poland | 95.3 /100 | #114 | Exceptional $106,319 |
| Immigrants | Kuwait | 95.2 /100 | #115 | Exceptional $106,285 |
| British | 95.2 /100 | #116 | Exceptional $106,264 |
| Albanians | 95.1 /100 | #117 | Exceptional $106,243 |
| Immigrants | Western Asia | 95.0 /100 | #118 | Exceptional $106,217 |
| Immigrants | Jordan | 94.9 /100 | #119 | Exceptional $106,164 |
| Immigrants | South Eastern Asia | 94.8 /100 | #120 | Exceptional $106,109 |
| Poles | 94.4 /100 | #121 | Exceptional $105,952 |