Immigrants from Iraq vs Immigrants from Moldova Householder Income Ages 45 - 64 years
COMPARE
Immigrants from Iraq
Immigrants from Moldova
Householder Income Ages 45 - 64 years
Householder Income Ages 45 - 64 years Comparison
Immigrants from Iraq
Immigrants from Moldova
$98,201
HOUSEHOLDER INCOME AGES 45 - 64 YEARS
25.7/ 100
METRIC RATING
198th/ 347
METRIC RANK
$107,357
HOUSEHOLDER INCOME AGES 45 - 64 YEARS
97.1/ 100
METRIC RATING
102nd/ 347
METRIC RANK
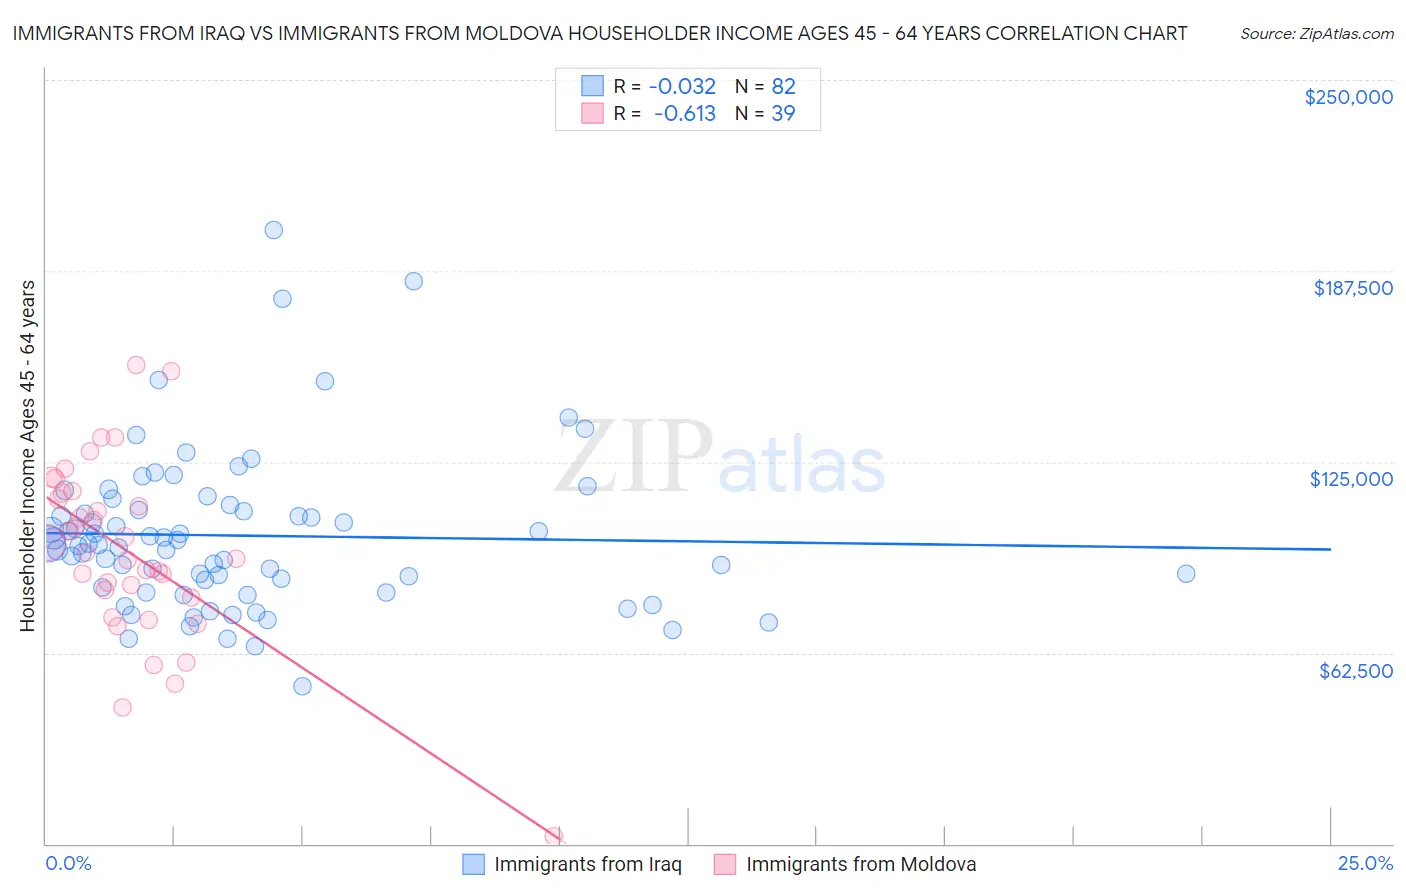
Immigrants from Iraq vs Immigrants from Moldova Householder Income Ages 45 - 64 years Correlation Chart
The statistical analysis conducted on geographies consisting of 194,713,152 people shows no correlation between the proportion of Immigrants from Iraq and household income with householder between the ages 45 and 64 in the United States with a correlation coefficient (R) of -0.032 and weighted average of $98,201. Similarly, the statistical analysis conducted on geographies consisting of 124,350,842 people shows a significant negative correlation between the proportion of Immigrants from Moldova and household income with householder between the ages 45 and 64 in the United States with a correlation coefficient (R) of -0.613 and weighted average of $107,357, a difference of 9.3%.
Householder Income Ages 45 - 64 years Correlation Summary
| Measurement | Immigrants from Iraq | Immigrants from Moldova |
| Minimum | $51,559 | $2,499 |
| Maximum | $200,985 | $156,555 |
| Range | $149,426 | $154,056 |
| Mean | $100,846 | $95,532 |
| Median | $97,854 | $95,372 |
| Interquartile 25% (IQ1) | $83,774 | $80,570 |
| Interquartile 75% (IQ3) | $109,332 | $114,888 |
| Interquartile Range (IQR) | $25,558 | $34,318 |
| Standard Deviation (Sample) | $25,905 | $29,698 |
| Standard Deviation (Population) | $25,746 | $29,315 |
Similar Demographics by Householder Income Ages 45 - 64 years
Demographics Similar to Immigrants from Iraq by Householder Income Ages 45 - 64 years
In terms of householder income ages 45 - 64 years, the demographic groups most similar to Immigrants from Iraq are White/Caucasian ($98,091, a difference of 0.11%), Puget Sound Salish ($98,340, a difference of 0.14%), Immigrants from Kenya ($97,964, a difference of 0.24%), Immigrants from Eastern Africa ($98,467, a difference of 0.27%), and Spanish ($98,554, a difference of 0.36%).
| Demographics | Rating | Rank | Householder Income Ages 45 - 64 years |
| Kenyans | 33.7 /100 | #191 | Fair $98,970 |
| Celtics | 32.9 /100 | #192 | Fair $98,896 |
| Hawaiians | 31.6 /100 | #193 | Fair $98,778 |
| Uruguayans | 30.3 /100 | #194 | Fair $98,660 |
| Spanish | 29.2 /100 | #195 | Fair $98,554 |
| Immigrants | Eastern Africa | 28.3 /100 | #196 | Fair $98,467 |
| Puget Sound Salish | 27.0 /100 | #197 | Fair $98,340 |
| Immigrants | Iraq | 25.7 /100 | #198 | Fair $98,201 |
| Whites/Caucasians | 24.6 /100 | #199 | Fair $98,091 |
| Immigrants | Kenya | 23.5 /100 | #200 | Fair $97,964 |
| Yugoslavians | 20.0 /100 | #201 | Fair $97,558 |
| Tlingit-Haida | 18.9 /100 | #202 | Poor $97,417 |
| Immigrants | Thailand | 18.8 /100 | #203 | Poor $97,400 |
| Immigrants | Eritrea | 18.6 /100 | #204 | Poor $97,373 |
| Immigrants | Colombia | 18.0 /100 | #205 | Poor $97,290 |
Demographics Similar to Immigrants from Moldova by Householder Income Ages 45 - 64 years
In terms of householder income ages 45 - 64 years, the demographic groups most similar to Immigrants from Moldova are Immigrants from Kazakhstan ($107,378, a difference of 0.020%), Syrian ($107,207, a difference of 0.14%), Immigrants from Serbia ($107,569, a difference of 0.20%), Immigrants from Ukraine ($107,079, a difference of 0.26%), and Macedonian ($107,074, a difference of 0.26%).
| Demographics | Rating | Rank | Householder Income Ages 45 - 64 years |
| Immigrants | Hungary | 98.2 /100 | #95 | Exceptional $108,267 |
| Immigrants | Argentina | 98.2 /100 | #96 | Exceptional $108,264 |
| Northern Europeans | 97.8 /100 | #97 | Exceptional $107,870 |
| Immigrants | Southern Europe | 97.7 /100 | #98 | Exceptional $107,775 |
| Palestinians | 97.6 /100 | #99 | Exceptional $107,721 |
| Immigrants | Serbia | 97.4 /100 | #100 | Exceptional $107,569 |
| Immigrants | Kazakhstan | 97.2 /100 | #101 | Exceptional $107,378 |
| Immigrants | Moldova | 97.1 /100 | #102 | Exceptional $107,357 |
| Syrians | 96.9 /100 | #103 | Exceptional $107,207 |
| Immigrants | Ukraine | 96.7 /100 | #104 | Exceptional $107,079 |
| Macedonians | 96.7 /100 | #105 | Exceptional $107,074 |
| Armenians | 96.6 /100 | #106 | Exceptional $107,002 |
| Immigrants | Fiji | 96.5 /100 | #107 | Exceptional $106,952 |
| Zimbabweans | 96.3 /100 | #108 | Exceptional $106,849 |
| Chileans | 95.9 /100 | #109 | Exceptional $106,611 |