Immigrants from Dominican Republic vs Immigrants from Dominica No Schooling Completed
COMPARE
Immigrants from Dominican Republic
Immigrants from Dominica
No Schooling Completed
No Schooling Completed Comparison
Immigrants from Dominican Republic
Immigrants from Dominica
3.4%
NO SCHOOLING COMPLETED
0.0/ 100
METRIC RATING
333rd/ 347
METRIC RANK
2.8%
NO SCHOOLING COMPLETED
0.0/ 100
METRIC RATING
298th/ 347
METRIC RANK
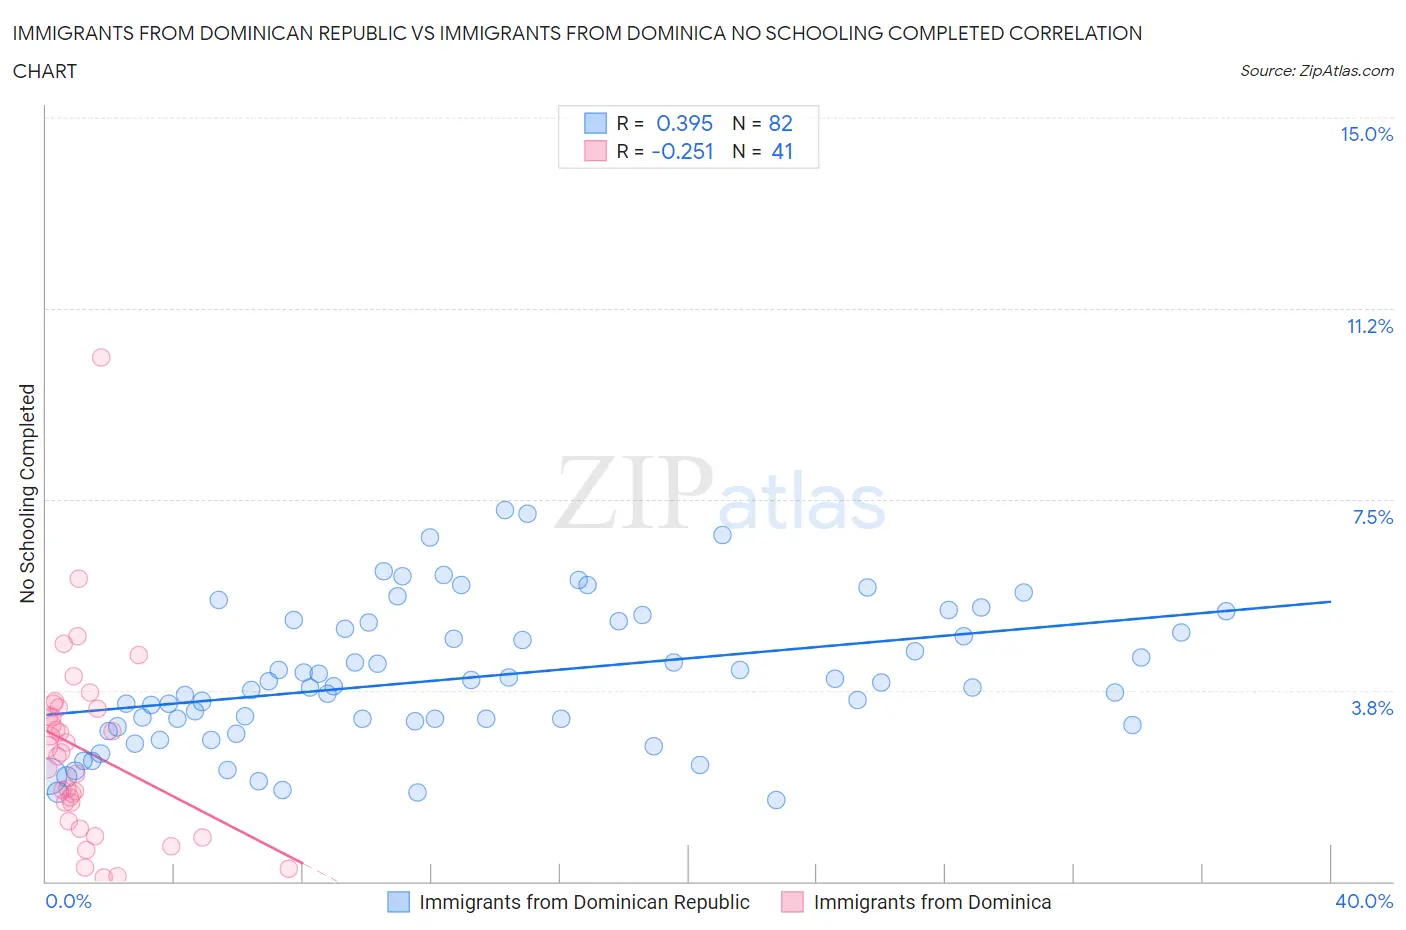
Immigrants from Dominican Republic vs Immigrants from Dominica No Schooling Completed Correlation Chart
The statistical analysis conducted on geographies consisting of 273,675,959 people shows a mild positive correlation between the proportion of Immigrants from Dominican Republic and percentage of population with no schooling in the United States with a correlation coefficient (R) of 0.395 and weighted average of 3.4%. Similarly, the statistical analysis conducted on geographies consisting of 83,717,936 people shows a weak negative correlation between the proportion of Immigrants from Dominica and percentage of population with no schooling in the United States with a correlation coefficient (R) of -0.251 and weighted average of 2.8%, a difference of 20.1%.
No Schooling Completed Correlation Summary
| Measurement | Immigrants from Dominican Republic | Immigrants from Dominica |
| Minimum | 1.6% | 0.065% |
| Maximum | 7.3% | 10.3% |
| Range | 5.7% | 10.2% |
| Mean | 4.0% | 2.6% |
| Median | 3.8% | 2.5% |
| Interquartile 25% (IQ1) | 3.1% | 1.4% |
| Interquartile 75% (IQ3) | 5.1% | 3.4% |
| Interquartile Range (IQR) | 2.0% | 2.0% |
| Standard Deviation (Sample) | 1.4% | 1.9% |
| Standard Deviation (Population) | 1.4% | 1.8% |
Similar Demographics by No Schooling Completed
Demographics Similar to Immigrants from Dominican Republic by No Schooling Completed
In terms of no schooling completed, the demographic groups most similar to Immigrants from Dominican Republic are Central American (3.4%, a difference of 0.060%), Japanese (3.3%, a difference of 1.6%), Immigrants from Armenia (3.3%, a difference of 1.6%), Guatemalan (3.5%, a difference of 1.8%), and Immigrants from Vietnam (3.3%, a difference of 2.0%).
| Demographics | Rating | Rank | No Schooling Completed |
| Indonesians | 0.0 /100 | #326 | Tragic 3.2% |
| Immigrants | Latin America | 0.0 /100 | #327 | Tragic 3.3% |
| Mexicans | 0.0 /100 | #328 | Tragic 3.3% |
| Immigrants | Vietnam | 0.0 /100 | #329 | Tragic 3.3% |
| Immigrants | Armenia | 0.0 /100 | #330 | Tragic 3.3% |
| Japanese | 0.0 /100 | #331 | Tragic 3.3% |
| Central Americans | 0.0 /100 | #332 | Tragic 3.4% |
| Immigrants | Dominican Republic | 0.0 /100 | #333 | Tragic 3.4% |
| Guatemalans | 0.0 /100 | #334 | Tragic 3.5% |
| Immigrants | Cambodia | 0.0 /100 | #335 | Tragic 3.5% |
| Immigrants | Fiji | 0.0 /100 | #336 | Tragic 3.5% |
| Immigrants | Cabo Verde | 0.0 /100 | #337 | Tragic 3.5% |
| Bangladeshis | 0.0 /100 | #338 | Tragic 3.5% |
| Yakama | 0.0 /100 | #339 | Tragic 3.6% |
| Immigrants | Guatemala | 0.0 /100 | #340 | Tragic 3.6% |
Demographics Similar to Immigrants from Dominica by No Schooling Completed
In terms of no schooling completed, the demographic groups most similar to Immigrants from Dominica are Immigrants from Cuba (2.8%, a difference of 0.33%), Central American Indian (2.8%, a difference of 0.51%), Haitian (2.9%, a difference of 0.83%), Immigrants (2.8%, a difference of 1.5%), and Houma (2.8%, a difference of 1.6%).
| Demographics | Rating | Rank | No Schooling Completed |
| British West Indians | 0.0 /100 | #291 | Tragic 2.7% |
| Immigrants | Grenada | 0.0 /100 | #292 | Tragic 2.8% |
| Malaysians | 0.0 /100 | #293 | Tragic 2.8% |
| Immigrants | Eritrea | 0.0 /100 | #294 | Tragic 2.8% |
| Houma | 0.0 /100 | #295 | Tragic 2.8% |
| Immigrants | Immigrants | 0.0 /100 | #296 | Tragic 2.8% |
| Immigrants | Cuba | 0.0 /100 | #297 | Tragic 2.8% |
| Immigrants | Dominica | 0.0 /100 | #298 | Tragic 2.8% |
| Central American Indians | 0.0 /100 | #299 | Tragic 2.8% |
| Haitians | 0.0 /100 | #300 | Tragic 2.9% |
| Immigrants | South Eastern Asia | 0.0 /100 | #301 | Tragic 2.9% |
| Immigrants | Caribbean | 0.0 /100 | #302 | Tragic 2.9% |
| Somalis | 0.0 /100 | #303 | Tragic 2.9% |
| Nicaraguans | 0.0 /100 | #304 | Tragic 2.9% |
| Ecuadorians | 0.0 /100 | #305 | Tragic 3.0% |