Immigrants from Dominican Republic vs Venezuelan Median Family Income
COMPARE
Immigrants from Dominican Republic
Venezuelan
Median Family Income
Median Family Income Comparison
Immigrants from Dominican Republic
Venezuelans
$81,233
MEDIAN FAMILY INCOME
0.0/ 100
METRIC RATING
331st/ 347
METRIC RANK
$96,281
MEDIAN FAMILY INCOME
3.7/ 100
METRIC RATING
223rd/ 347
METRIC RANK
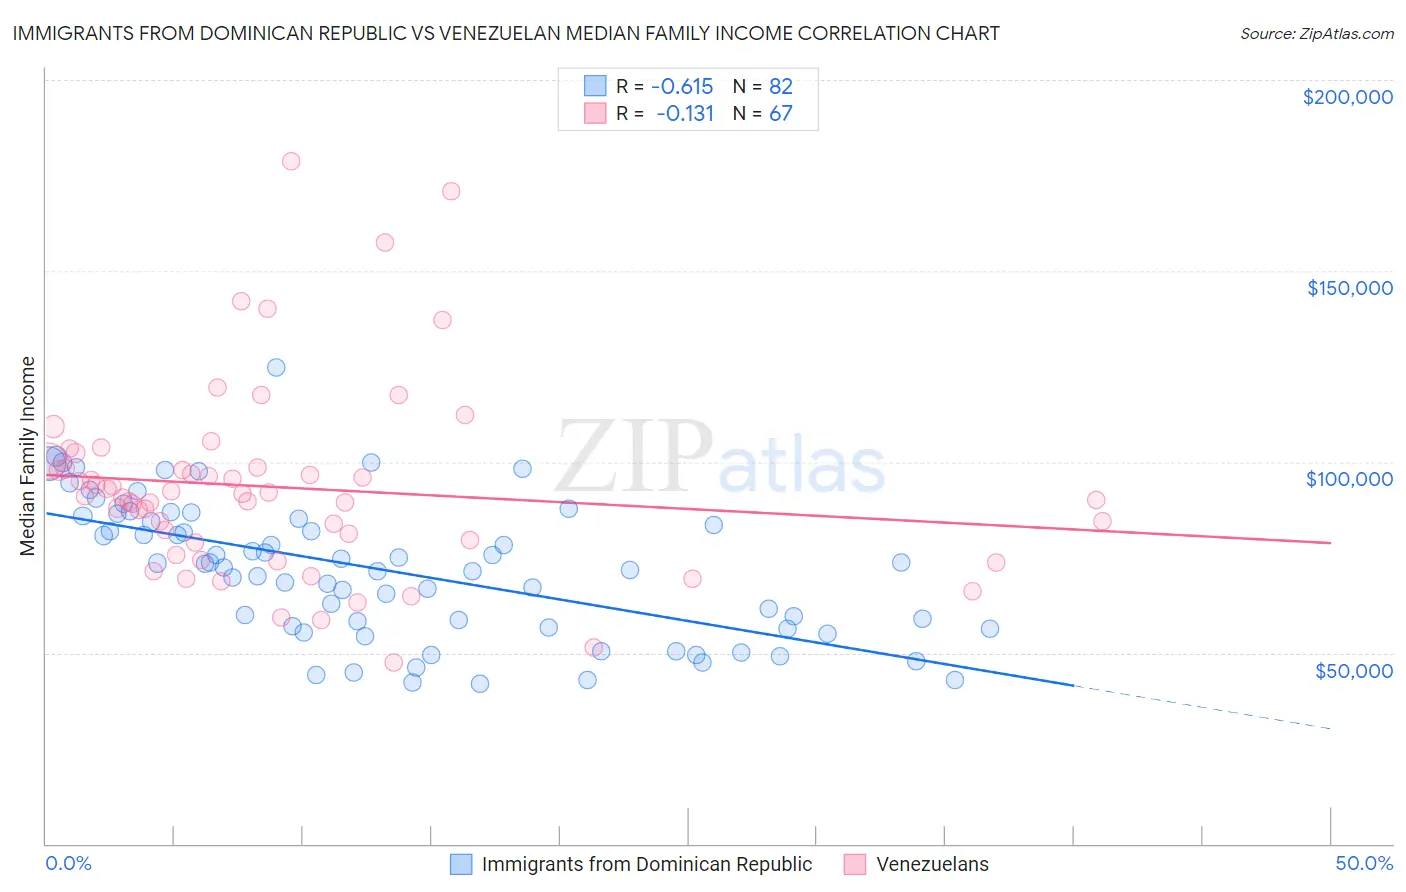
Immigrants from Dominican Republic vs Venezuelan Median Family Income Correlation Chart
The statistical analysis conducted on geographies consisting of 274,877,743 people shows a significant negative correlation between the proportion of Immigrants from Dominican Republic and median family income in the United States with a correlation coefficient (R) of -0.615 and weighted average of $81,233. Similarly, the statistical analysis conducted on geographies consisting of 306,049,967 people shows a poor negative correlation between the proportion of Venezuelans and median family income in the United States with a correlation coefficient (R) of -0.131 and weighted average of $96,281, a difference of 18.5%.
Median Family Income Correlation Summary
| Measurement | Immigrants from Dominican Republic | Venezuelan |
| Minimum | $41,996 | $47,465 |
| Maximum | $124,734 | $178,821 |
| Range | $82,738 | $131,356 |
| Mean | $71,698 | $93,300 |
| Median | $72,932 | $91,055 |
| Interquartile 25% (IQ1) | $56,743 | $78,904 |
| Interquartile 75% (IQ3) | $84,954 | $98,659 |
| Interquartile Range (IQR) | $28,211 | $19,755 |
| Standard Deviation (Sample) | $17,899 | $24,946 |
| Standard Deviation (Population) | $17,789 | $24,759 |
Similar Demographics by Median Family Income
Demographics Similar to Immigrants from Dominican Republic by Median Family Income
In terms of median family income, the demographic groups most similar to Immigrants from Dominican Republic are Cheyenne ($81,385, a difference of 0.19%), Native/Alaskan ($80,908, a difference of 0.40%), Kiowa ($80,885, a difference of 0.43%), Dutch West Indian ($81,852, a difference of 0.76%), and Black/African American ($81,912, a difference of 0.84%).
| Demographics | Rating | Rank | Median Family Income |
| Creek | 0.0 /100 | #324 | Tragic $82,560 |
| Sioux | 0.0 /100 | #325 | Tragic $82,386 |
| Immigrants | Congo | 0.0 /100 | #326 | Tragic $82,216 |
| Arapaho | 0.0 /100 | #327 | Tragic $82,064 |
| Blacks/African Americans | 0.0 /100 | #328 | Tragic $81,912 |
| Dutch West Indians | 0.0 /100 | #329 | Tragic $81,852 |
| Cheyenne | 0.0 /100 | #330 | Tragic $81,385 |
| Immigrants | Dominican Republic | 0.0 /100 | #331 | Tragic $81,233 |
| Natives/Alaskans | 0.0 /100 | #332 | Tragic $80,908 |
| Kiowa | 0.0 /100 | #333 | Tragic $80,885 |
| Menominee | 0.0 /100 | #334 | Tragic $79,563 |
| Yup'ik | 0.0 /100 | #335 | Tragic $79,290 |
| Immigrants | Cuba | 0.0 /100 | #336 | Tragic $78,249 |
| Yuman | 0.0 /100 | #337 | Tragic $78,055 |
| Immigrants | Yemen | 0.0 /100 | #338 | Tragic $77,457 |
Demographics Similar to Venezuelans by Median Family Income
In terms of median family income, the demographic groups most similar to Venezuelans are Nonimmigrants ($96,231, a difference of 0.050%), Immigrants from Nigeria ($96,439, a difference of 0.16%), Vietnamese ($96,123, a difference of 0.16%), Immigrants from Ghana ($96,544, a difference of 0.27%), and Sudanese ($96,783, a difference of 0.52%).
| Demographics | Rating | Rank | Median Family Income |
| Immigrants | Bosnia and Herzegovina | 6.4 /100 | #216 | Tragic $97,432 |
| Japanese | 6.0 /100 | #217 | Tragic $97,288 |
| Immigrants | Cambodia | 5.8 /100 | #218 | Tragic $97,222 |
| Delaware | 5.1 /100 | #219 | Tragic $96,958 |
| Sudanese | 4.7 /100 | #220 | Tragic $96,783 |
| Immigrants | Ghana | 4.2 /100 | #221 | Tragic $96,544 |
| Immigrants | Nigeria | 4.0 /100 | #222 | Tragic $96,439 |
| Venezuelans | 3.7 /100 | #223 | Tragic $96,281 |
| Immigrants | Nonimmigrants | 3.6 /100 | #224 | Tragic $96,231 |
| Vietnamese | 3.4 /100 | #225 | Tragic $96,123 |
| Immigrants | Panama | 2.7 /100 | #226 | Tragic $95,647 |
| Alaska Natives | 2.6 /100 | #227 | Tragic $95,573 |
| Immigrants | Azores | 2.4 /100 | #228 | Tragic $95,402 |
| Marshallese | 2.2 /100 | #229 | Tragic $95,293 |
| Malaysians | 2.2 /100 | #230 | Tragic $95,230 |