Immigrants from Morocco vs Iroquois Median Household Income
COMPARE
Immigrants from Morocco
Iroquois
Median Household Income
Median Household Income Comparison
Immigrants from Morocco
Iroquois
$87,930
MEDIAN HOUSEHOLD INCOME
86.0/ 100
METRIC RATING
141st/ 347
METRIC RANK
$74,279
MEDIAN HOUSEHOLD INCOME
0.1/ 100
METRIC RATING
287th/ 347
METRIC RANK
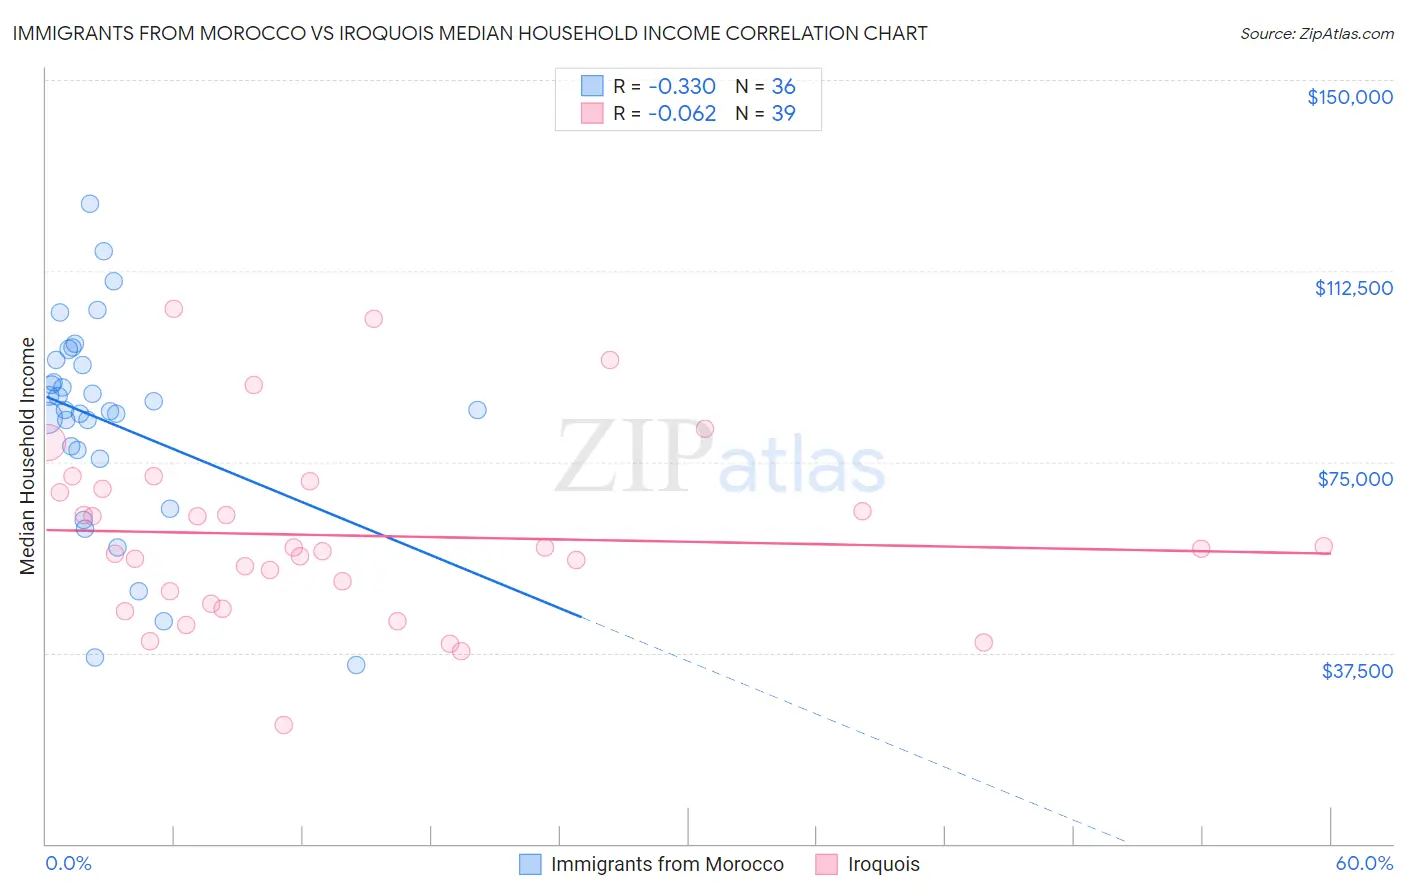
Immigrants from Morocco vs Iroquois Median Household Income Correlation Chart
The statistical analysis conducted on geographies consisting of 178,909,382 people shows a mild negative correlation between the proportion of Immigrants from Morocco and median household income in the United States with a correlation coefficient (R) of -0.330 and weighted average of $87,930. Similarly, the statistical analysis conducted on geographies consisting of 207,210,720 people shows a slight negative correlation between the proportion of Iroquois and median household income in the United States with a correlation coefficient (R) of -0.062 and weighted average of $74,279, a difference of 18.4%.
Median Household Income Correlation Summary
| Measurement | Immigrants from Morocco | Iroquois |
| Minimum | $35,000 | $23,438 |
| Maximum | $125,707 | $105,077 |
| Range | $90,707 | $81,639 |
| Mean | $82,911 | $60,531 |
| Median | $85,268 | $57,969 |
| Interquartile 25% (IQ1) | $76,412 | $47,045 |
| Interquartile 75% (IQ3) | $94,485 | $69,753 |
| Interquartile Range (IQR) | $18,073 | $22,708 |
| Standard Deviation (Sample) | $20,524 | $17,808 |
| Standard Deviation (Population) | $20,237 | $17,578 |
Similar Demographics by Median Household Income
Demographics Similar to Immigrants from Morocco by Median Household Income
In terms of median household income, the demographic groups most similar to Immigrants from Morocco are Lebanese ($88,091, a difference of 0.18%), Canadian ($87,769, a difference of 0.18%), Danish ($87,676, a difference of 0.29%), Serbian ($87,572, a difference of 0.41%), and Ugandan ($87,557, a difference of 0.43%).
| Demographics | Rating | Rank | Median Household Income |
| Swedes | 90.0 /100 | #134 | Exceptional $88,524 |
| Immigrants | Sierra Leone | 89.9 /100 | #135 | Excellent $88,498 |
| Poles | 89.7 /100 | #136 | Excellent $88,472 |
| Sierra Leoneans | 89.6 /100 | #137 | Excellent $88,463 |
| Arabs | 89.2 /100 | #138 | Excellent $88,398 |
| Immigrants | Chile | 89.2 /100 | #139 | Excellent $88,388 |
| Lebanese | 87.2 /100 | #140 | Excellent $88,091 |
| Immigrants | Morocco | 86.0 /100 | #141 | Excellent $87,930 |
| Canadians | 84.7 /100 | #142 | Excellent $87,769 |
| Danes | 83.9 /100 | #143 | Excellent $87,676 |
| Serbians | 83.0 /100 | #144 | Excellent $87,572 |
| Ugandans | 82.9 /100 | #145 | Excellent $87,557 |
| Immigrants | Uganda | 82.8 /100 | #146 | Excellent $87,553 |
| South American Indians | 81.8 /100 | #147 | Excellent $87,446 |
| Costa Ricans | 80.0 /100 | #148 | Excellent $87,262 |
Demographics Similar to Iroquois by Median Household Income
In terms of median household income, the demographic groups most similar to Iroquois are Immigrants from Somalia ($74,300, a difference of 0.030%), Immigrants from Central America ($74,217, a difference of 0.080%), Fijian ($74,205, a difference of 0.10%), Mexican ($74,399, a difference of 0.16%), and Bangladeshi ($74,112, a difference of 0.23%).
| Demographics | Rating | Rank | Median Household Income |
| Senegalese | 0.2 /100 | #280 | Tragic $74,999 |
| Immigrants | Liberia | 0.1 /100 | #281 | Tragic $74,896 |
| Central American Indians | 0.1 /100 | #282 | Tragic $74,847 |
| Cree | 0.1 /100 | #283 | Tragic $74,685 |
| Yaqui | 0.1 /100 | #284 | Tragic $74,596 |
| Mexicans | 0.1 /100 | #285 | Tragic $74,399 |
| Immigrants | Somalia | 0.1 /100 | #286 | Tragic $74,300 |
| Iroquois | 0.1 /100 | #287 | Tragic $74,279 |
| Immigrants | Central America | 0.1 /100 | #288 | Tragic $74,217 |
| Fijians | 0.1 /100 | #289 | Tragic $74,205 |
| Bangladeshis | 0.1 /100 | #290 | Tragic $74,112 |
| Hispanics or Latinos | 0.1 /100 | #291 | Tragic $73,823 |
| Comanche | 0.1 /100 | #292 | Tragic $73,747 |
| Immigrants | Cabo Verde | 0.1 /100 | #293 | Tragic $73,515 |
| Blackfeet | 0.1 /100 | #294 | Tragic $73,509 |