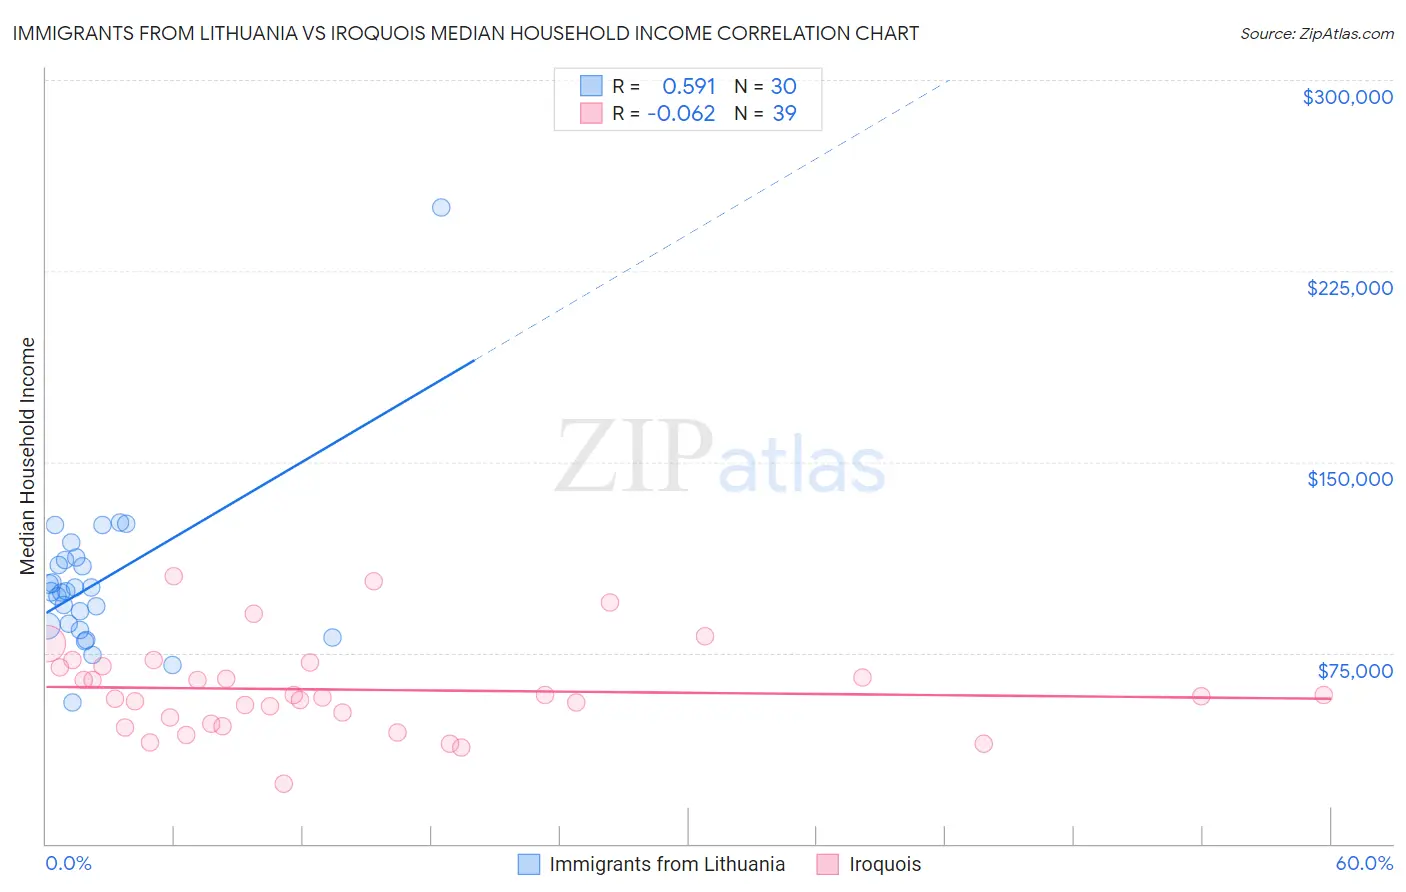
Immigrants from Lithuania vs Iroquois Median Household Income
COMPARE
Immigrants from Lithuania
Iroquois
Median Household Income
Median Household Income Comparison
Immigrants from Lithuania
Iroquois
$96,836
MEDIAN HOUSEHOLD INCOME
99.9/ 100
METRIC RATING
42nd/ 347
METRIC RANK
$74,279
MEDIAN HOUSEHOLD INCOME
0.1/ 100
METRIC RATING
287th/ 347
METRIC RANK
Immigrants from Lithuania vs Iroquois Median Household Income Correlation Chart
The statistical analysis conducted on geographies consisting of 117,713,976 people shows a substantial positive correlation between the proportion of Immigrants from Lithuania and median household income in the United States with a correlation coefficient (R) of 0.591 and weighted average of $96,836. Similarly, the statistical analysis conducted on geographies consisting of 207,210,720 people shows a slight negative correlation between the proportion of Iroquois and median household income in the United States with a correlation coefficient (R) of -0.062 and weighted average of $74,279, a difference of 30.4%.
Median Household Income Correlation Summary
| Measurement | Immigrants from Lithuania | Iroquois |
| Minimum | $55,636 | $23,438 |
| Maximum | $250,001 | $105,077 |
| Range | $194,365 | $81,639 |
| Mean | $102,979 | $60,531 |
| Median | $99,018 | $57,969 |
| Interquartile 25% (IQ1) | $85,668 | $47,045 |
| Interquartile 75% (IQ3) | $111,586 | $69,753 |
| Interquartile Range (IQR) | $25,918 | $22,708 |
| Standard Deviation (Sample) | $32,780 | $17,808 |
| Standard Deviation (Population) | $32,229 | $17,578 |
Similar Demographics by Median Household Income
Demographics Similar to Immigrants from Lithuania by Median Household Income
In terms of median household income, the demographic groups most similar to Immigrants from Lithuania are Immigrants from France ($96,743, a difference of 0.10%), Immigrants from Turkey ($96,964, a difference of 0.13%), Immigrants from Greece ($96,675, a difference of 0.17%), Maltese ($97,015, a difference of 0.18%), and Afghan ($97,026, a difference of 0.20%).
| Demographics | Rating | Rank | Median Household Income |
| Immigrants | Switzerland | 100.0 /100 | #35 | Exceptional $97,979 |
| Immigrants | Pakistan | 100.0 /100 | #36 | Exceptional $97,528 |
| Latvians | 100.0 /100 | #37 | Exceptional $97,311 |
| Immigrants | Indonesia | 100.0 /100 | #38 | Exceptional $97,297 |
| Afghans | 100.0 /100 | #39 | Exceptional $97,026 |
| Maltese | 100.0 /100 | #40 | Exceptional $97,015 |
| Immigrants | Turkey | 100.0 /100 | #41 | Exceptional $96,964 |
| Immigrants | Lithuania | 99.9 /100 | #42 | Exceptional $96,836 |
| Immigrants | France | 99.9 /100 | #43 | Exceptional $96,743 |
| Immigrants | Greece | 99.9 /100 | #44 | Exceptional $96,675 |
| Israelis | 99.9 /100 | #45 | Exceptional $96,552 |
| Australians | 99.9 /100 | #46 | Exceptional $96,490 |
| Immigrants | Russia | 99.9 /100 | #47 | Exceptional $96,378 |
| Cambodians | 99.9 /100 | #48 | Exceptional $96,324 |
| Immigrants | Malaysia | 99.9 /100 | #49 | Exceptional $96,292 |
Demographics Similar to Iroquois by Median Household Income
In terms of median household income, the demographic groups most similar to Iroquois are Immigrants from Somalia ($74,300, a difference of 0.030%), Immigrants from Central America ($74,217, a difference of 0.080%), Fijian ($74,205, a difference of 0.10%), Mexican ($74,399, a difference of 0.16%), and Bangladeshi ($74,112, a difference of 0.23%).
| Demographics | Rating | Rank | Median Household Income |
| Senegalese | 0.2 /100 | #280 | Tragic $74,999 |
| Immigrants | Liberia | 0.1 /100 | #281 | Tragic $74,896 |
| Central American Indians | 0.1 /100 | #282 | Tragic $74,847 |
| Cree | 0.1 /100 | #283 | Tragic $74,685 |
| Yaqui | 0.1 /100 | #284 | Tragic $74,596 |
| Mexicans | 0.1 /100 | #285 | Tragic $74,399 |
| Immigrants | Somalia | 0.1 /100 | #286 | Tragic $74,300 |
| Iroquois | 0.1 /100 | #287 | Tragic $74,279 |
| Immigrants | Central America | 0.1 /100 | #288 | Tragic $74,217 |
| Fijians | 0.1 /100 | #289 | Tragic $74,205 |
| Bangladeshis | 0.1 /100 | #290 | Tragic $74,112 |
| Hispanics or Latinos | 0.1 /100 | #291 | Tragic $73,823 |
| Comanche | 0.1 /100 | #292 | Tragic $73,747 |
| Immigrants | Cabo Verde | 0.1 /100 | #293 | Tragic $73,515 |
| Blackfeet | 0.1 /100 | #294 | Tragic $73,509 |