Immigrants from Denmark vs Iroquois 3rd Grade
COMPARE
Immigrants from Denmark
Iroquois
3rd Grade
3rd Grade Comparison
Immigrants from Denmark
Iroquois
98.1%
3RD GRADE
98.8/ 100
METRIC RATING
87th/ 347
METRIC RANK
98.0%
3RD GRADE
94.1/ 100
METRIC RATING
121st/ 347
METRIC RANK
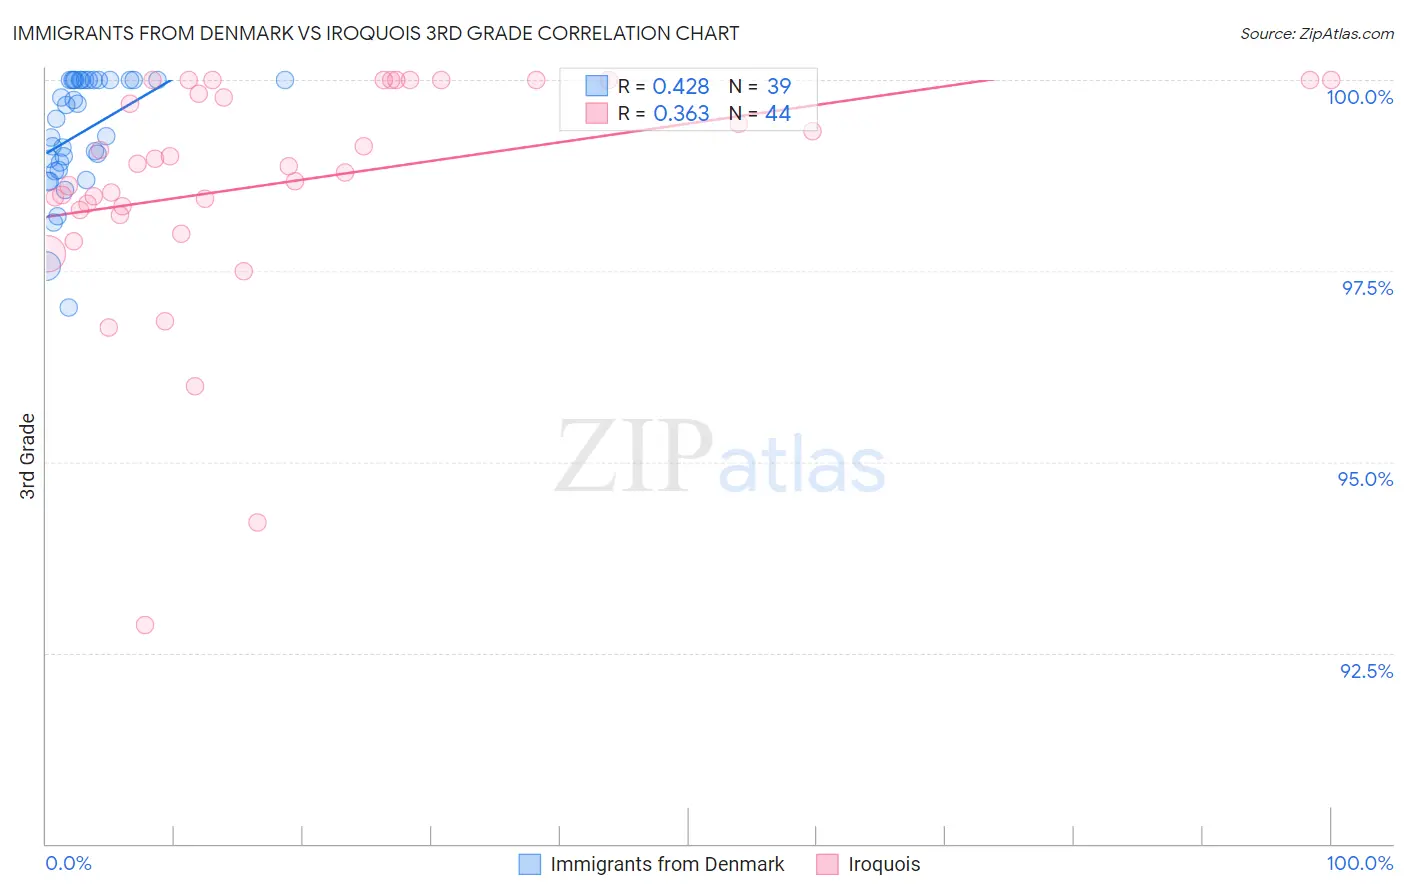
Immigrants from Denmark vs Iroquois 3rd Grade Correlation Chart
The statistical analysis conducted on geographies consisting of 136,428,049 people shows a moderate positive correlation between the proportion of Immigrants from Denmark and percentage of population with at least 3rd grade education in the United States with a correlation coefficient (R) of 0.428 and weighted average of 98.1%. Similarly, the statistical analysis conducted on geographies consisting of 207,308,056 people shows a mild positive correlation between the proportion of Iroquois and percentage of population with at least 3rd grade education in the United States with a correlation coefficient (R) of 0.363 and weighted average of 98.0%, a difference of 0.14%.
3rd Grade Correlation Summary
| Measurement | Immigrants from Denmark | Iroquois |
| Minimum | 97.0% | 92.9% |
| Maximum | 100.0% | 100.0% |
| Range | 3.0% | 7.1% |
| Mean | 99.3% | 98.7% |
| Median | 99.5% | 98.9% |
| Interquartile 25% (IQ1) | 98.8% | 98.3% |
| Interquartile 75% (IQ3) | 100.0% | 100.0% |
| Interquartile Range (IQR) | 1.2% | 1.7% |
| Standard Deviation (Sample) | 0.75% | 1.5% |
| Standard Deviation (Population) | 0.74% | 1.5% |
Similar Demographics by 3rd Grade
Demographics Similar to Immigrants from Denmark by 3rd Grade
In terms of 3rd grade, the demographic groups most similar to Immigrants from Denmark are Immigrants from Sweden (98.1%, a difference of 0.0%), Immigrants from Australia (98.1%, a difference of 0.0%), Potawatomi (98.1%, a difference of 0.0%), Immigrants from India (98.1%, a difference of 0.0%), and Delaware (98.1%, a difference of 0.0%).
| Demographics | Rating | Rank | 3rd Grade |
| Macedonians | 99.1 /100 | #80 | Exceptional 98.1% |
| Icelanders | 99.1 /100 | #81 | Exceptional 98.1% |
| Shoshone | 99.0 /100 | #82 | Exceptional 98.1% |
| Ukrainians | 98.9 /100 | #83 | Exceptional 98.1% |
| Immigrants | Sweden | 98.9 /100 | #84 | Exceptional 98.1% |
| Immigrants | Australia | 98.9 /100 | #85 | Exceptional 98.1% |
| Potawatomi | 98.9 /100 | #86 | Exceptional 98.1% |
| Immigrants | Denmark | 98.8 /100 | #87 | Exceptional 98.1% |
| Immigrants | India | 98.8 /100 | #88 | Exceptional 98.1% |
| Delaware | 98.8 /100 | #89 | Exceptional 98.1% |
| Zimbabweans | 98.8 /100 | #90 | Exceptional 98.1% |
| Hopi | 98.7 /100 | #91 | Exceptional 98.1% |
| Immigrants | South Africa | 98.7 /100 | #92 | Exceptional 98.1% |
| Immigrants | Western Europe | 98.7 /100 | #93 | Exceptional 98.1% |
| Immigrants | Germany | 98.4 /100 | #94 | Exceptional 98.1% |
Demographics Similar to Iroquois by 3rd Grade
In terms of 3rd grade, the demographic groups most similar to Iroquois are Immigrants from Croatia (98.0%, a difference of 0.0%), Lebanese (98.0%, a difference of 0.0%), Iranian (98.0%, a difference of 0.010%), Spanish (98.0%, a difference of 0.010%), and Syrian (98.0%, a difference of 0.010%).
| Demographics | Rating | Rank | 3rd Grade |
| Menominee | 95.4 /100 | #114 | Exceptional 98.0% |
| Okinawans | 95.2 /100 | #115 | Exceptional 98.0% |
| Immigrants | Norway | 95.2 /100 | #116 | Exceptional 98.0% |
| Immigrants | France | 95.1 /100 | #117 | Exceptional 98.0% |
| Iranians | 94.9 /100 | #118 | Exceptional 98.0% |
| Spanish | 94.8 /100 | #119 | Exceptional 98.0% |
| Immigrants | Croatia | 94.4 /100 | #120 | Exceptional 98.0% |
| Iroquois | 94.1 /100 | #121 | Exceptional 98.0% |
| Lebanese | 94.1 /100 | #122 | Exceptional 98.0% |
| Syrians | 93.8 /100 | #123 | Exceptional 98.0% |
| Immigrants | Japan | 93.7 /100 | #124 | Exceptional 98.0% |
| Immigrants | Saudi Arabia | 93.5 /100 | #125 | Exceptional 98.0% |
| Immigrants | Zimbabwe | 93.4 /100 | #126 | Exceptional 98.0% |
| Ute | 93.2 /100 | #127 | Exceptional 98.0% |
| Colville | 92.1 /100 | #128 | Exceptional 98.0% |