Immigrants from Denmark vs Immigrants from Japan Divorced or Separated
COMPARE
Immigrants from Denmark
Immigrants from Japan
Divorced or Separated
Divorced or Separated Comparison
Immigrants from Denmark
Immigrants from Japan
11.6%
DIVORCED OR SEPARATED
98.9/ 100
METRIC RATING
92nd/ 347
METRIC RANK
11.1%
DIVORCED OR SEPARATED
100.0/ 100
METRIC RATING
36th/ 347
METRIC RANK
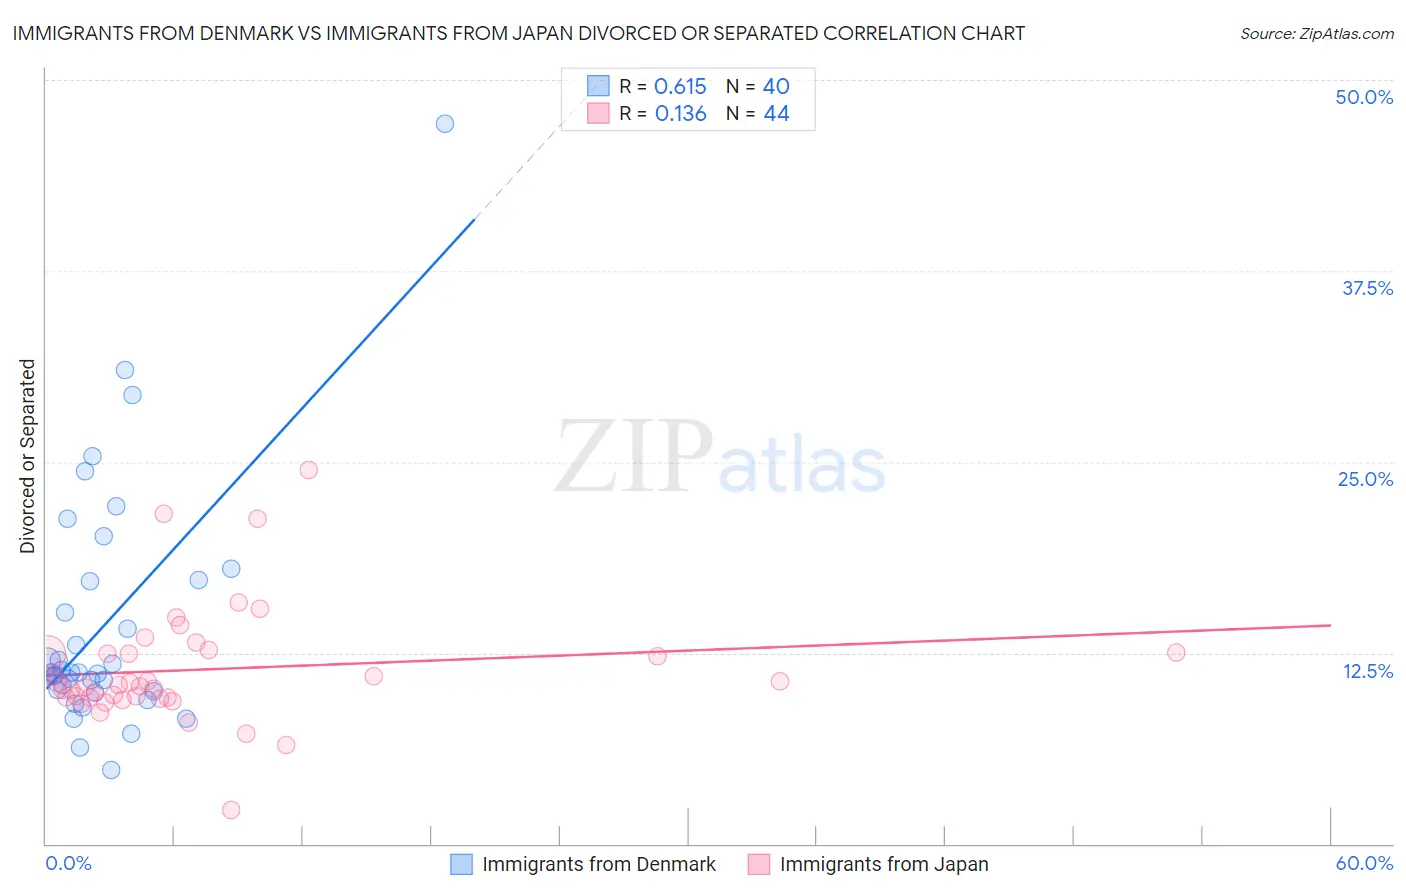
Immigrants from Denmark vs Immigrants from Japan Divorced or Separated Correlation Chart
The statistical analysis conducted on geographies consisting of 136,412,843 people shows a significant positive correlation between the proportion of Immigrants from Denmark and percentage of population currently divorced or separated in the United States with a correlation coefficient (R) of 0.615 and weighted average of 11.6%. Similarly, the statistical analysis conducted on geographies consisting of 340,021,973 people shows a poor positive correlation between the proportion of Immigrants from Japan and percentage of population currently divorced or separated in the United States with a correlation coefficient (R) of 0.136 and weighted average of 11.1%, a difference of 4.3%.
Divorced or Separated Correlation Summary
| Measurement | Immigrants from Denmark | Immigrants from Japan |
| Minimum | 4.8% | 2.2% |
| Maximum | 47.1% | 24.5% |
| Range | 42.3% | 22.3% |
| Mean | 14.4% | 11.4% |
| Median | 11.2% | 10.4% |
| Interquartile 25% (IQ1) | 10.0% | 9.6% |
| Interquartile 75% (IQ3) | 17.2% | 12.5% |
| Interquartile Range (IQR) | 7.2% | 2.9% |
| Standard Deviation (Sample) | 8.1% | 3.9% |
| Standard Deviation (Population) | 8.0% | 3.8% |
Similar Demographics by Divorced or Separated
Demographics Similar to Immigrants from Denmark by Divorced or Separated
In terms of divorced or separated, the demographic groups most similar to Immigrants from Denmark are Arab (11.6%, a difference of 0.0%), Immigrants from Fiji (11.6%, a difference of 0.010%), Spanish American Indian (11.6%, a difference of 0.060%), Zimbabwean (11.6%, a difference of 0.10%), and Immigrants from Serbia (11.6%, a difference of 0.11%).
| Demographics | Rating | Rank | Divorced or Separated |
| Immigrants | Albania | 99.3 /100 | #85 | Exceptional 11.5% |
| Immigrants | Latvia | 99.2 /100 | #86 | Exceptional 11.6% |
| Immigrants | Nepal | 99.2 /100 | #87 | Exceptional 11.6% |
| Immigrants | Europe | 99.2 /100 | #88 | Exceptional 11.6% |
| Immigrants | Southern Europe | 99.1 /100 | #89 | Exceptional 11.6% |
| Zimbabweans | 99.0 /100 | #90 | Exceptional 11.6% |
| Spanish American Indians | 99.0 /100 | #91 | Exceptional 11.6% |
| Immigrants | Denmark | 98.9 /100 | #92 | Exceptional 11.6% |
| Arabs | 98.9 /100 | #93 | Exceptional 11.6% |
| Immigrants | Fiji | 98.9 /100 | #94 | Exceptional 11.6% |
| Immigrants | Serbia | 98.8 /100 | #95 | Exceptional 11.6% |
| Immigrants | Ukraine | 98.7 /100 | #96 | Exceptional 11.6% |
| Latvians | 98.7 /100 | #97 | Exceptional 11.6% |
| Immigrants | Jordan | 98.6 /100 | #98 | Exceptional 11.6% |
| Immigrants | Sweden | 98.6 /100 | #99 | Exceptional 11.6% |
Demographics Similar to Immigrants from Japan by Divorced or Separated
In terms of divorced or separated, the demographic groups most similar to Immigrants from Japan are Immigrants from Lebanon (11.1%, a difference of 0.010%), Cambodian (11.1%, a difference of 0.060%), Immigrants from Greece (11.1%, a difference of 0.070%), Immigrants from Uzbekistan (11.1%, a difference of 0.14%), and Egyptian (11.1%, a difference of 0.21%).
| Demographics | Rating | Rank | Divorced or Separated |
| Armenians | 100.0 /100 | #29 | Exceptional 11.0% |
| Immigrants | Ireland | 100.0 /100 | #30 | Exceptional 11.0% |
| Mongolians | 100.0 /100 | #31 | Exceptional 11.1% |
| Tongans | 100.0 /100 | #32 | Exceptional 11.1% |
| Egyptians | 100.0 /100 | #33 | Exceptional 11.1% |
| Immigrants | Uzbekistan | 100.0 /100 | #34 | Exceptional 11.1% |
| Cambodians | 100.0 /100 | #35 | Exceptional 11.1% |
| Immigrants | Japan | 100.0 /100 | #36 | Exceptional 11.1% |
| Immigrants | Lebanon | 100.0 /100 | #37 | Exceptional 11.1% |
| Immigrants | Greece | 100.0 /100 | #38 | Exceptional 11.1% |
| Immigrants | Egypt | 100.0 /100 | #39 | Exceptional 11.1% |
| Soviet Union | 100.0 /100 | #40 | Exceptional 11.1% |
| Bhutanese | 100.0 /100 | #41 | Exceptional 11.2% |
| Chinese | 100.0 /100 | #42 | Exceptional 11.2% |
| Immigrants | Belarus | 100.0 /100 | #43 | Exceptional 11.2% |