Immigrants from Turkey vs Immigrants from Eastern Asia Median Household Income
COMPARE
Immigrants from Turkey
Immigrants from Eastern Asia
Median Household Income
Median Household Income Comparison
Immigrants from Turkey
Immigrants from Eastern Asia
$96,964
MEDIAN HOUSEHOLD INCOME
100.0/ 100
METRIC RATING
41st/ 347
METRIC RANK
$104,796
MEDIAN HOUSEHOLD INCOME
100.0/ 100
METRIC RATING
13th/ 347
METRIC RANK
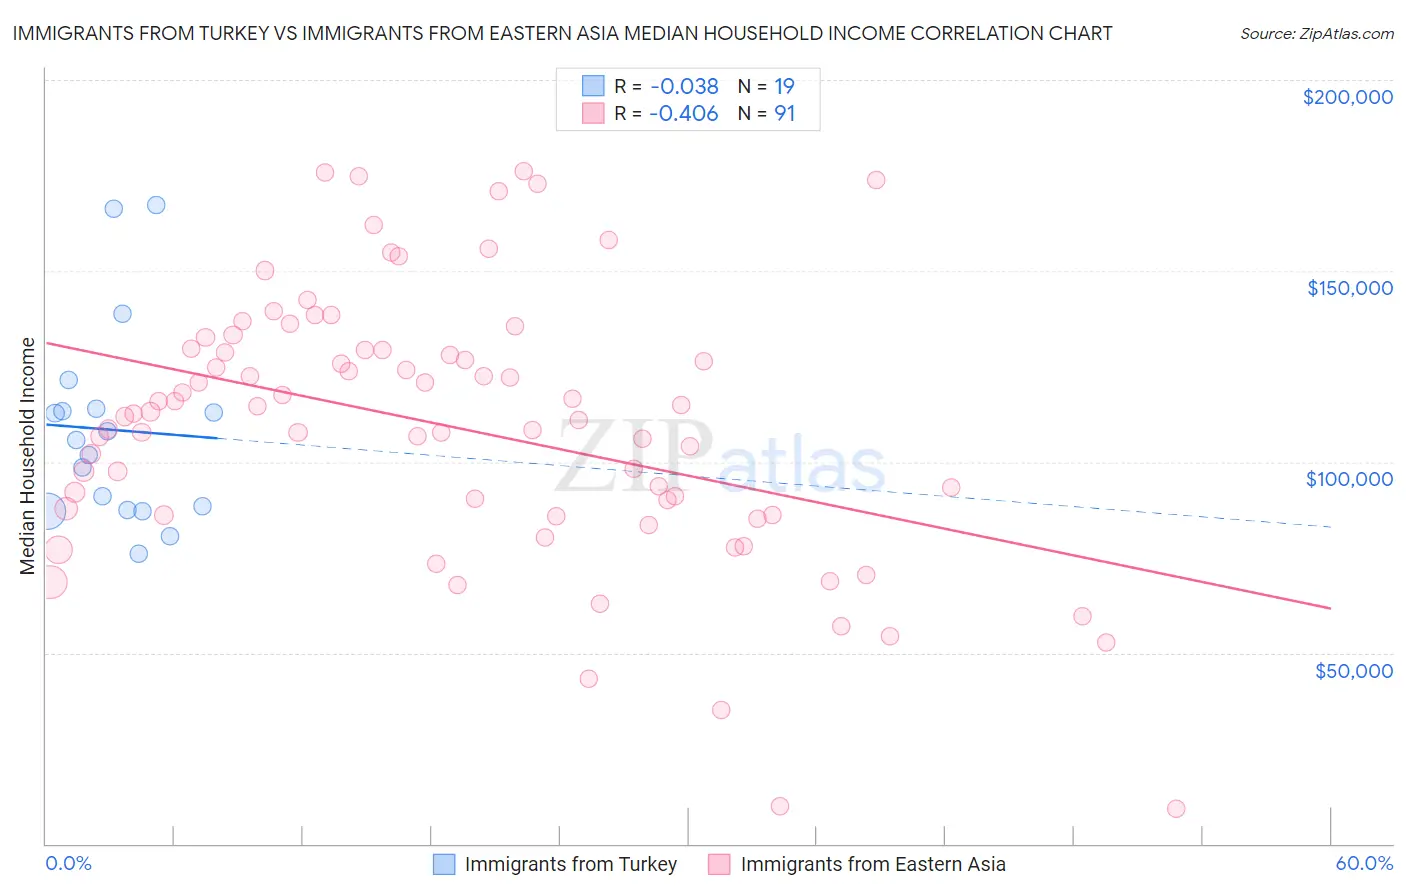
Immigrants from Turkey vs Immigrants from Eastern Asia Median Household Income Correlation Chart
The statistical analysis conducted on geographies consisting of 222,938,856 people shows no correlation between the proportion of Immigrants from Turkey and median household income in the United States with a correlation coefficient (R) of -0.038 and weighted average of $96,964. Similarly, the statistical analysis conducted on geographies consisting of 499,224,968 people shows a moderate negative correlation between the proportion of Immigrants from Eastern Asia and median household income in the United States with a correlation coefficient (R) of -0.406 and weighted average of $104,796, a difference of 8.1%.
Median Household Income Correlation Summary
| Measurement | Immigrants from Turkey | Immigrants from Eastern Asia |
| Minimum | $75,893 | $9,145 |
| Maximum | $167,317 | $175,983 |
| Range | $91,424 | $166,838 |
| Mean | $108,335 | $109,310 |
| Median | $105,608 | $112,551 |
| Interquartile 25% (IQ1) | $87,245 | $86,179 |
| Interquartile 75% (IQ3) | $113,867 | $129,240 |
| Interquartile Range (IQR) | $26,622 | $43,061 |
| Standard Deviation (Sample) | $25,883 | $35,066 |
| Standard Deviation (Population) | $25,193 | $34,873 |
Similar Demographics by Median Household Income
Demographics Similar to Immigrants from Turkey by Median Household Income
In terms of median household income, the demographic groups most similar to Immigrants from Turkey are Maltese ($97,015, a difference of 0.050%), Afghan ($97,026, a difference of 0.060%), Immigrants from Lithuania ($96,836, a difference of 0.13%), Immigrants from France ($96,743, a difference of 0.23%), and Immigrants from Greece ($96,675, a difference of 0.30%).
| Demographics | Rating | Rank | Median Household Income |
| Russians | 100.0 /100 | #34 | Exceptional $98,008 |
| Immigrants | Switzerland | 100.0 /100 | #35 | Exceptional $97,979 |
| Immigrants | Pakistan | 100.0 /100 | #36 | Exceptional $97,528 |
| Latvians | 100.0 /100 | #37 | Exceptional $97,311 |
| Immigrants | Indonesia | 100.0 /100 | #38 | Exceptional $97,297 |
| Afghans | 100.0 /100 | #39 | Exceptional $97,026 |
| Maltese | 100.0 /100 | #40 | Exceptional $97,015 |
| Immigrants | Turkey | 100.0 /100 | #41 | Exceptional $96,964 |
| Immigrants | Lithuania | 99.9 /100 | #42 | Exceptional $96,836 |
| Immigrants | France | 99.9 /100 | #43 | Exceptional $96,743 |
| Immigrants | Greece | 99.9 /100 | #44 | Exceptional $96,675 |
| Israelis | 99.9 /100 | #45 | Exceptional $96,552 |
| Australians | 99.9 /100 | #46 | Exceptional $96,490 |
| Immigrants | Russia | 99.9 /100 | #47 | Exceptional $96,378 |
| Cambodians | 99.9 /100 | #48 | Exceptional $96,324 |
Demographics Similar to Immigrants from Eastern Asia by Median Household Income
In terms of median household income, the demographic groups most similar to Immigrants from Eastern Asia are Immigrants from Ireland ($104,692, a difference of 0.10%), Indian (Asian) ($105,262, a difference of 0.45%), Immigrants from China ($105,335, a difference of 0.51%), Immigrants from Israel ($104,090, a difference of 0.68%), and Immigrants from South Central Asia ($106,057, a difference of 1.2%).
| Demographics | Rating | Rank | Median Household Income |
| Immigrants | Singapore | 100.0 /100 | #6 | Exceptional $110,428 |
| Iranians | 100.0 /100 | #7 | Exceptional $109,835 |
| Immigrants | Iran | 100.0 /100 | #8 | Exceptional $108,055 |
| Okinawans | 100.0 /100 | #9 | Exceptional $106,624 |
| Immigrants | South Central Asia | 100.0 /100 | #10 | Exceptional $106,057 |
| Immigrants | China | 100.0 /100 | #11 | Exceptional $105,335 |
| Indians (Asian) | 100.0 /100 | #12 | Exceptional $105,262 |
| Immigrants | Eastern Asia | 100.0 /100 | #13 | Exceptional $104,796 |
| Immigrants | Ireland | 100.0 /100 | #14 | Exceptional $104,692 |
| Immigrants | Israel | 100.0 /100 | #15 | Exceptional $104,090 |
| Burmese | 100.0 /100 | #16 | Exceptional $103,145 |
| Immigrants | Korea | 100.0 /100 | #17 | Exceptional $102,962 |
| Cypriots | 100.0 /100 | #18 | Exceptional $102,843 |
| Immigrants | Australia | 100.0 /100 | #19 | Exceptional $102,562 |
| Bolivians | 100.0 /100 | #20 | Exceptional $102,195 |