Immigrants from Nicaragua vs French Canadian Householder Income Under 25 years
COMPARE
Immigrants from Nicaragua
French Canadian
Householder Income Under 25 years
Householder Income Under 25 years Comparison
Immigrants from Nicaragua
French Canadians
$53,266
HOUSEHOLDER INCOME UNDER 25 YEARS
93.3/ 100
METRIC RATING
131st/ 347
METRIC RANK
$52,672
HOUSEHOLDER INCOME UNDER 25 YEARS
76.5/ 100
METRIC RATING
148th/ 347
METRIC RANK
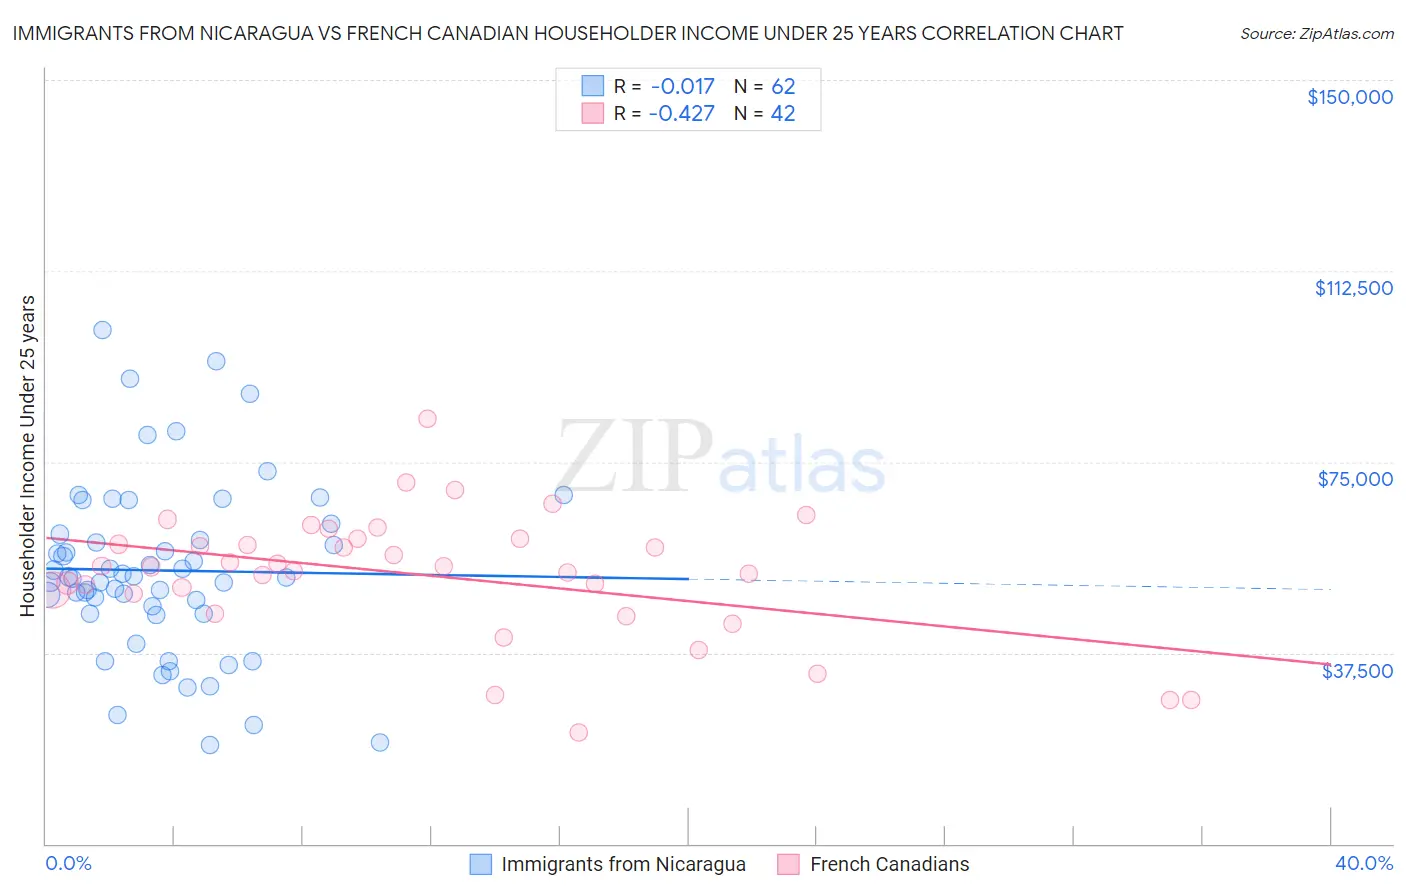
Immigrants from Nicaragua vs French Canadian Householder Income Under 25 years Correlation Chart
The statistical analysis conducted on geographies consisting of 209,989,839 people shows no correlation between the proportion of Immigrants from Nicaragua and household income with householder under the age of 25 in the United States with a correlation coefficient (R) of -0.017 and weighted average of $53,266. Similarly, the statistical analysis conducted on geographies consisting of 404,051,752 people shows a moderate negative correlation between the proportion of French Canadians and household income with householder under the age of 25 in the United States with a correlation coefficient (R) of -0.427 and weighted average of $52,672, a difference of 1.1%.
Householder Income Under 25 years Correlation Summary
| Measurement | Immigrants from Nicaragua | French Canadian |
| Minimum | $19,455 | $21,875 |
| Maximum | $100,948 | $83,420 |
| Range | $81,493 | $61,545 |
| Mean | $53,656 | $52,741 |
| Median | $52,382 | $54,485 |
| Interquartile 25% (IQ1) | $45,288 | $49,010 |
| Interquartile 75% (IQ3) | $60,822 | $59,797 |
| Interquartile Range (IQR) | $15,534 | $10,788 |
| Standard Deviation (Sample) | $17,142 | $12,369 |
| Standard Deviation (Population) | $17,003 | $12,221 |
Demographics Similar to Immigrants from Nicaragua and French Canadians by Householder Income Under 25 years
In terms of householder income under 25 years, the demographic groups most similar to Immigrants from Nicaragua are Nicaraguan ($53,275, a difference of 0.020%), Moroccan ($53,256, a difference of 0.020%), New Zealander ($53,294, a difference of 0.050%), Immigrants ($53,201, a difference of 0.12%), and Immigrants from Northern Africa ($53,185, a difference of 0.15%). Similarly, the demographic groups most similar to French Canadians are Scandinavian ($52,654, a difference of 0.030%), Latvian ($52,783, a difference of 0.21%), Immigrants from Hungary ($52,798, a difference of 0.24%), Immigrants from Western Europe ($52,957, a difference of 0.54%), and South American Indian ($52,979, a difference of 0.58%).
| Demographics | Rating | Rank | Householder Income Under 25 years |
| New Zealanders | 93.7 /100 | #129 | Exceptional $53,294 |
| Nicaraguans | 93.4 /100 | #130 | Exceptional $53,275 |
| Immigrants | Nicaragua | 93.3 /100 | #131 | Exceptional $53,266 |
| Moroccans | 93.1 /100 | #132 | Exceptional $53,256 |
| Immigrants | Immigrants | 92.2 /100 | #133 | Exceptional $53,201 |
| Immigrants | Northern Africa | 91.9 /100 | #134 | Exceptional $53,185 |
| Chileans | 91.9 /100 | #135 | Exceptional $53,185 |
| Armenians | 91.8 /100 | #136 | Exceptional $53,179 |
| Immigrants | Barbados | 91.5 /100 | #137 | Exceptional $53,163 |
| Norwegians | 90.8 /100 | #138 | Exceptional $53,127 |
| Costa Ricans | 90.4 /100 | #139 | Exceptional $53,106 |
| Hawaiians | 89.8 /100 | #140 | Excellent $53,078 |
| Danes | 88.9 /100 | #141 | Excellent $53,041 |
| Immigrants | Armenia | 87.5 /100 | #142 | Excellent $52,986 |
| Swedes | 87.5 /100 | #143 | Excellent $52,986 |
| South American Indians | 87.3 /100 | #144 | Excellent $52,979 |
| Immigrants | Western Europe | 86.7 /100 | #145 | Excellent $52,957 |
| Immigrants | Hungary | 81.6 /100 | #146 | Excellent $52,798 |
| Latvians | 81.0 /100 | #147 | Excellent $52,783 |
| French Canadians | 76.5 /100 | #148 | Good $52,672 |
| Scandinavians | 75.7 /100 | #149 | Good $52,654 |