Immigrants from Czechoslovakia vs Arapaho Associate's Degree
COMPARE
Immigrants from Czechoslovakia
Arapaho
Associate's Degree
Associate's Degree Comparison
Immigrants from Czechoslovakia
Arapaho
51.9%
ASSOCIATE'S DEGREE
99.8/ 100
METRIC RATING
56th/ 347
METRIC RANK
36.7%
ASSOCIATE'S DEGREE
0.0/ 100
METRIC RATING
324th/ 347
METRIC RANK
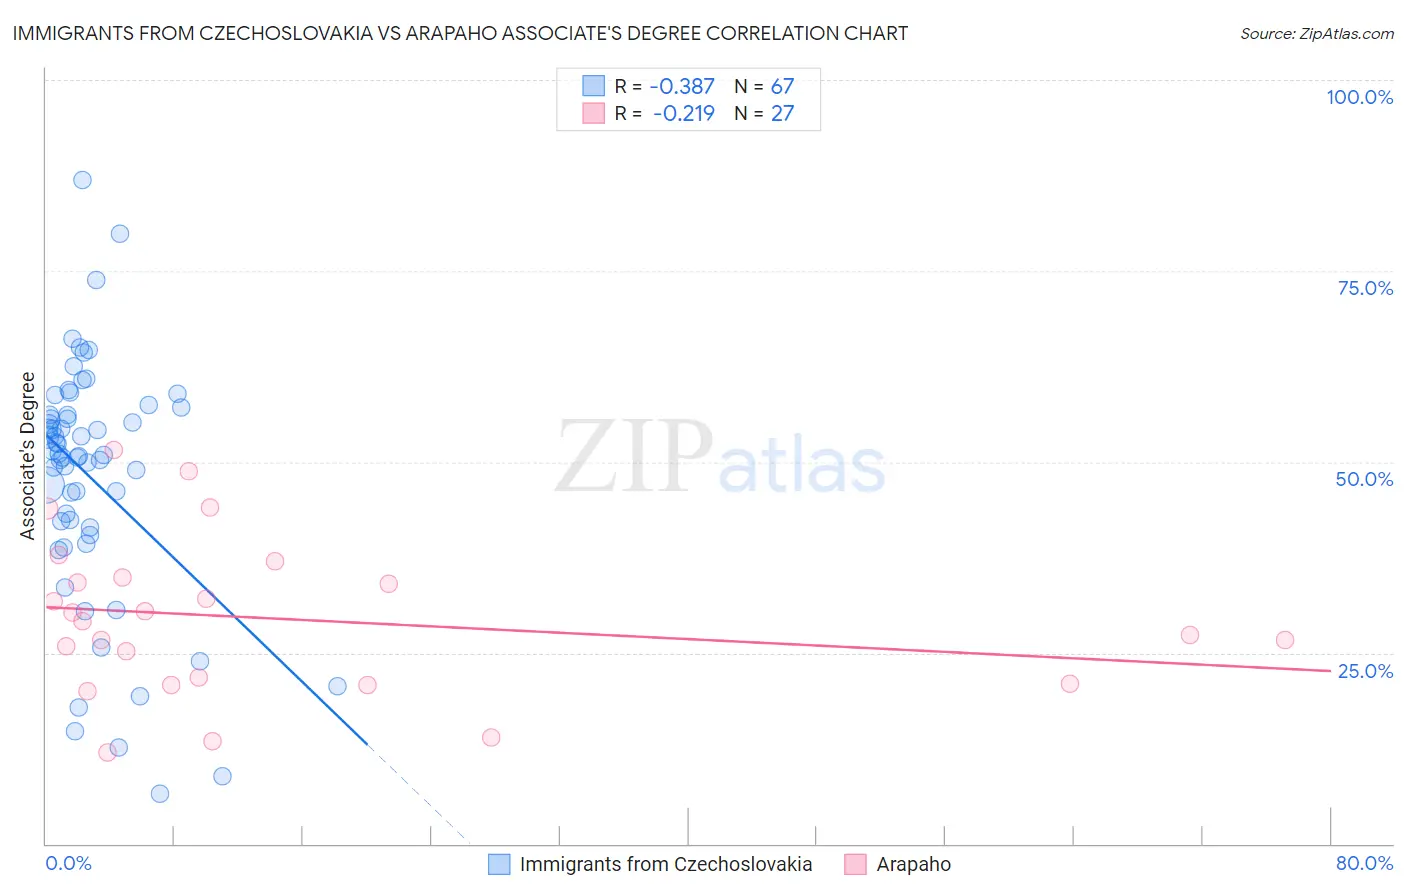
Immigrants from Czechoslovakia vs Arapaho Associate's Degree Correlation Chart
The statistical analysis conducted on geographies consisting of 195,448,477 people shows a mild negative correlation between the proportion of Immigrants from Czechoslovakia and percentage of population with at least associate's degree education in the United States with a correlation coefficient (R) of -0.387 and weighted average of 51.9%. Similarly, the statistical analysis conducted on geographies consisting of 29,779,330 people shows a weak negative correlation between the proportion of Arapaho and percentage of population with at least associate's degree education in the United States with a correlation coefficient (R) of -0.219 and weighted average of 36.7%, a difference of 41.3%.
Associate's Degree Correlation Summary
| Measurement | Immigrants from Czechoslovakia | Arapaho |
| Minimum | 6.6% | 11.9% |
| Maximum | 86.9% | 51.5% |
| Range | 80.3% | 39.6% |
| Mean | 47.9% | 29.5% |
| Median | 50.9% | 29.2% |
| Interquartile 25% (IQ1) | 41.4% | 21.0% |
| Interquartile 75% (IQ3) | 56.2% | 34.8% |
| Interquartile Range (IQR) | 14.7% | 13.8% |
| Standard Deviation (Sample) | 15.9% | 10.2% |
| Standard Deviation (Population) | 15.8% | 10.0% |
Similar Demographics by Associate's Degree
Demographics Similar to Immigrants from Czechoslovakia by Associate's Degree
In terms of associate's degree, the demographic groups most similar to Immigrants from Czechoslovakia are Australian (51.9%, a difference of 0.020%), Immigrants from Spain (51.9%, a difference of 0.050%), Paraguayan (51.8%, a difference of 0.12%), Immigrants from Asia (52.0%, a difference of 0.15%), and New Zealander (51.8%, a difference of 0.15%).
| Demographics | Rating | Rank | Associate's Degree |
| Immigrants | Austria | 99.9 /100 | #49 | Exceptional 52.1% |
| Asians | 99.9 /100 | #50 | Exceptional 52.1% |
| Immigrants | Greece | 99.9 /100 | #51 | Exceptional 52.1% |
| Bolivians | 99.8 /100 | #52 | Exceptional 52.0% |
| Immigrants | Asia | 99.8 /100 | #53 | Exceptional 52.0% |
| Immigrants | Spain | 99.8 /100 | #54 | Exceptional 51.9% |
| Australians | 99.8 /100 | #55 | Exceptional 51.9% |
| Immigrants | Czechoslovakia | 99.8 /100 | #56 | Exceptional 51.9% |
| Paraguayans | 99.8 /100 | #57 | Exceptional 51.8% |
| New Zealanders | 99.8 /100 | #58 | Exceptional 51.8% |
| Immigrants | Serbia | 99.8 /100 | #59 | Exceptional 51.7% |
| Immigrants | Bolivia | 99.7 /100 | #60 | Exceptional 51.5% |
| Immigrants | Kazakhstan | 99.7 /100 | #61 | Exceptional 51.4% |
| Bhutanese | 99.7 /100 | #62 | Exceptional 51.4% |
| South Africans | 99.7 /100 | #63 | Exceptional 51.4% |
Demographics Similar to Arapaho by Associate's Degree
In terms of associate's degree, the demographic groups most similar to Arapaho are Menominee (36.7%, a difference of 0.11%), Immigrants from Cabo Verde (36.8%, a difference of 0.16%), Kiowa (36.5%, a difference of 0.67%), Dutch West Indian (36.5%, a difference of 0.69%), and Alaskan Athabascan (36.5%, a difference of 0.70%).
| Demographics | Rating | Rank | Associate's Degree |
| Yaqui | 0.0 /100 | #317 | Tragic 37.6% |
| Alaska Natives | 0.0 /100 | #318 | Tragic 37.5% |
| Fijians | 0.0 /100 | #319 | Tragic 37.4% |
| Cajuns | 0.0 /100 | #320 | Tragic 37.4% |
| Immigrants | Yemen | 0.0 /100 | #321 | Tragic 37.3% |
| Pennsylvania Germans | 0.0 /100 | #322 | Tragic 37.2% |
| Immigrants | Cabo Verde | 0.0 /100 | #323 | Tragic 36.8% |
| Arapaho | 0.0 /100 | #324 | Tragic 36.7% |
| Menominee | 0.0 /100 | #325 | Tragic 36.7% |
| Kiowa | 0.0 /100 | #326 | Tragic 36.5% |
| Dutch West Indians | 0.0 /100 | #327 | Tragic 36.5% |
| Alaskan Athabascans | 0.0 /100 | #328 | Tragic 36.5% |
| Paiute | 0.0 /100 | #329 | Tragic 36.4% |
| Apache | 0.0 /100 | #330 | Tragic 36.2% |
| Immigrants | Azores | 0.0 /100 | #331 | Tragic 35.6% |