Immigrants from Croatia vs Sierra Leonean Unemployment Among Ages 20 to 24 years
COMPARE
Immigrants from Croatia
Sierra Leonean
Unemployment Among Ages 20 to 24 years
Unemployment Among Ages 20 to 24 years Comparison
Immigrants from Croatia
Sierra Leoneans
9.9%
UNEMPLOYMENT AMONG AGES 20 TO 24 YEARS
99.0/ 100
METRIC RATING
70th/ 347
METRIC RANK
11.5%
UNEMPLOYMENT AMONG AGES 20 TO 24 YEARS
0.0/ 100
METRIC RATING
276th/ 347
METRIC RANK
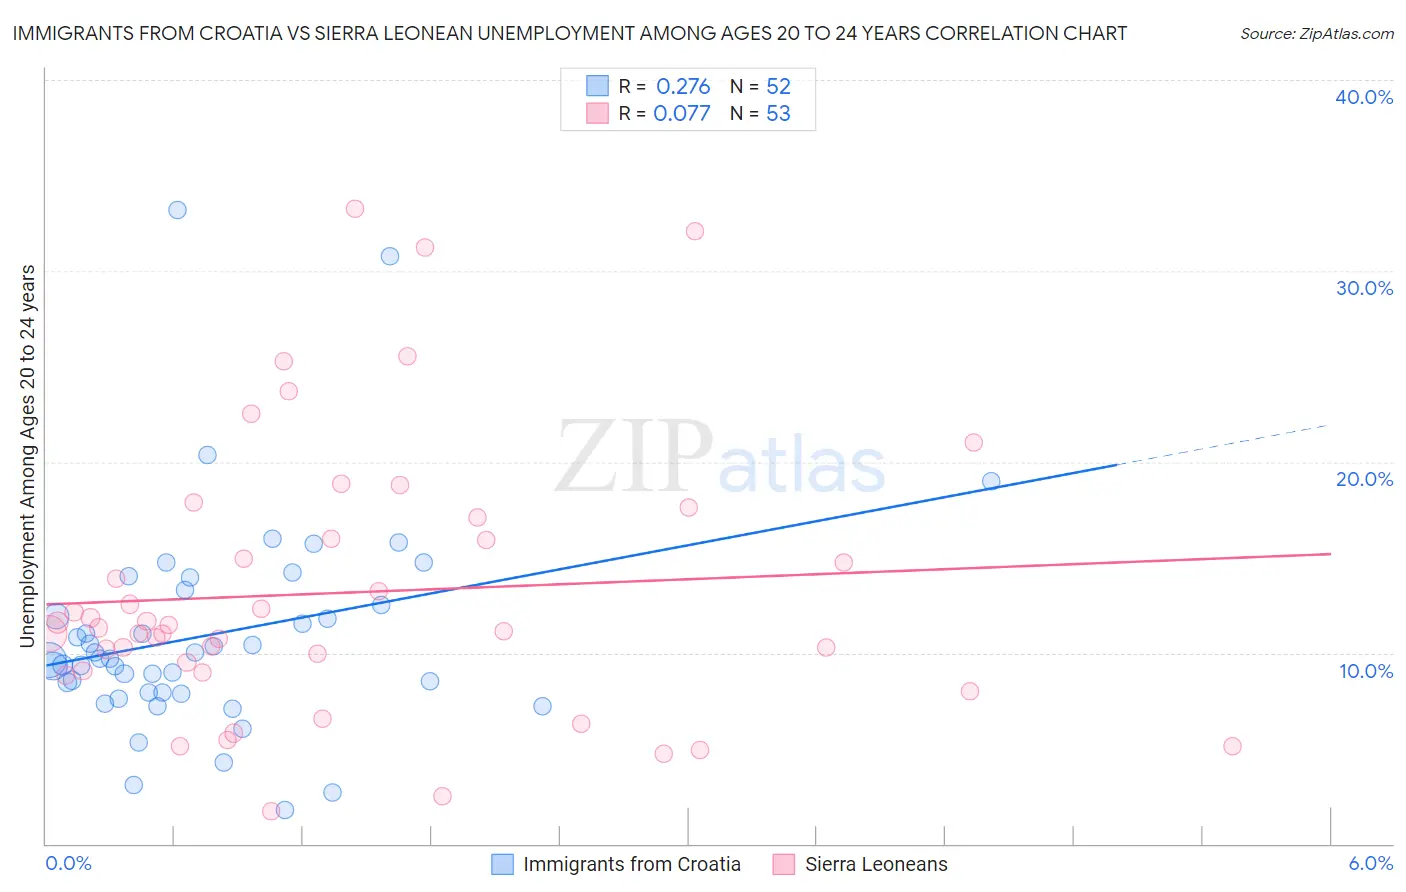
Immigrants from Croatia vs Sierra Leonean Unemployment Among Ages 20 to 24 years Correlation Chart
The statistical analysis conducted on geographies consisting of 130,896,610 people shows a weak positive correlation between the proportion of Immigrants from Croatia and unemployment rate among population between the ages 20 and 24 in the United States with a correlation coefficient (R) of 0.276 and weighted average of 9.9%. Similarly, the statistical analysis conducted on geographies consisting of 82,974,679 people shows a slight positive correlation between the proportion of Sierra Leoneans and unemployment rate among population between the ages 20 and 24 in the United States with a correlation coefficient (R) of 0.077 and weighted average of 11.5%, a difference of 16.8%.
Unemployment Among Ages 20 to 24 years Correlation Summary
| Measurement | Immigrants from Croatia | Sierra Leonean |
| Minimum | 1.8% | 1.7% |
| Maximum | 33.2% | 33.2% |
| Range | 31.4% | 31.5% |
| Mean | 11.0% | 13.2% |
| Median | 9.7% | 11.3% |
| Interquartile 25% (IQ1) | 7.9% | 9.0% |
| Interquartile 75% (IQ3) | 12.9% | 16.6% |
| Interquartile Range (IQR) | 5.0% | 7.5% |
| Standard Deviation (Sample) | 5.7% | 7.2% |
| Standard Deviation (Population) | 5.6% | 7.1% |
Similar Demographics by Unemployment Among Ages 20 to 24 years
Demographics Similar to Immigrants from Croatia by Unemployment Among Ages 20 to 24 years
In terms of unemployment among ages 20 to 24 years, the demographic groups most similar to Immigrants from Croatia are Celtic (9.9%, a difference of 0.030%), Bolivian (9.9%, a difference of 0.070%), Bulgarian (9.9%, a difference of 0.12%), Mongolian (9.9%, a difference of 0.20%), and Kenyan (9.9%, a difference of 0.21%).
| Demographics | Rating | Rank | Unemployment Among Ages 20 to 24 years |
| British | 99.4 /100 | #63 | Exceptional 9.8% |
| Serbians | 99.4 /100 | #64 | Exceptional 9.8% |
| Welsh | 99.3 /100 | #65 | Exceptional 9.8% |
| Scottish | 99.3 /100 | #66 | Exceptional 9.8% |
| Immigrants | Bolivia | 99.2 /100 | #67 | Exceptional 9.9% |
| Mongolians | 99.1 /100 | #68 | Exceptional 9.9% |
| Bulgarians | 99.1 /100 | #69 | Exceptional 9.9% |
| Immigrants | Croatia | 99.0 /100 | #70 | Exceptional 9.9% |
| Celtics | 98.9 /100 | #71 | Exceptional 9.9% |
| Bolivians | 98.9 /100 | #72 | Exceptional 9.9% |
| Kenyans | 98.7 /100 | #73 | Exceptional 9.9% |
| Immigrants | Laos | 98.7 /100 | #74 | Exceptional 9.9% |
| Immigrants | Australia | 98.6 /100 | #75 | Exceptional 9.9% |
| Czechoslovakians | 98.4 /100 | #76 | Exceptional 9.9% |
| Chickasaw | 98.4 /100 | #77 | Exceptional 9.9% |
Demographics Similar to Sierra Leoneans by Unemployment Among Ages 20 to 24 years
In terms of unemployment among ages 20 to 24 years, the demographic groups most similar to Sierra Leoneans are Senegalese (11.5%, a difference of 0.040%), African (11.5%, a difference of 0.15%), Colville (11.6%, a difference of 0.17%), Cape Verdean (11.5%, a difference of 0.40%), and Bahamian (11.6%, a difference of 0.43%).
| Demographics | Rating | Rank | Unemployment Among Ages 20 to 24 years |
| Ute | 0.0 /100 | #269 | Tragic 11.2% |
| Delaware | 0.0 /100 | #270 | Tragic 11.3% |
| Immigrants | Uzbekistan | 0.0 /100 | #271 | Tragic 11.4% |
| Nigerians | 0.0 /100 | #272 | Tragic 11.4% |
| Immigrants | Nigeria | 0.0 /100 | #273 | Tragic 11.5% |
| Cape Verdeans | 0.0 /100 | #274 | Tragic 11.5% |
| Senegalese | 0.0 /100 | #275 | Tragic 11.5% |
| Sierra Leoneans | 0.0 /100 | #276 | Tragic 11.5% |
| Africans | 0.0 /100 | #277 | Tragic 11.5% |
| Colville | 0.0 /100 | #278 | Tragic 11.6% |
| Bahamians | 0.0 /100 | #279 | Tragic 11.6% |
| Alaskan Athabascans | 0.0 /100 | #280 | Tragic 11.6% |
| Armenians | 0.0 /100 | #281 | Tragic 11.7% |
| Immigrants | Cameroon | 0.0 /100 | #282 | Tragic 11.7% |
| Ghanaians | 0.0 /100 | #283 | Tragic 11.7% |