Immigrants from Croatia vs Romanian Median Family Income
COMPARE
Immigrants from Croatia
Romanian
Median Family Income
Median Family Income Comparison
Immigrants from Croatia
Romanians
$112,323
MEDIAN FAMILY INCOME
99.3/ 100
METRIC RATING
80th/ 347
METRIC RANK
$111,243
MEDIAN FAMILY INCOME
98.8/ 100
METRIC RATING
88th/ 347
METRIC RANK
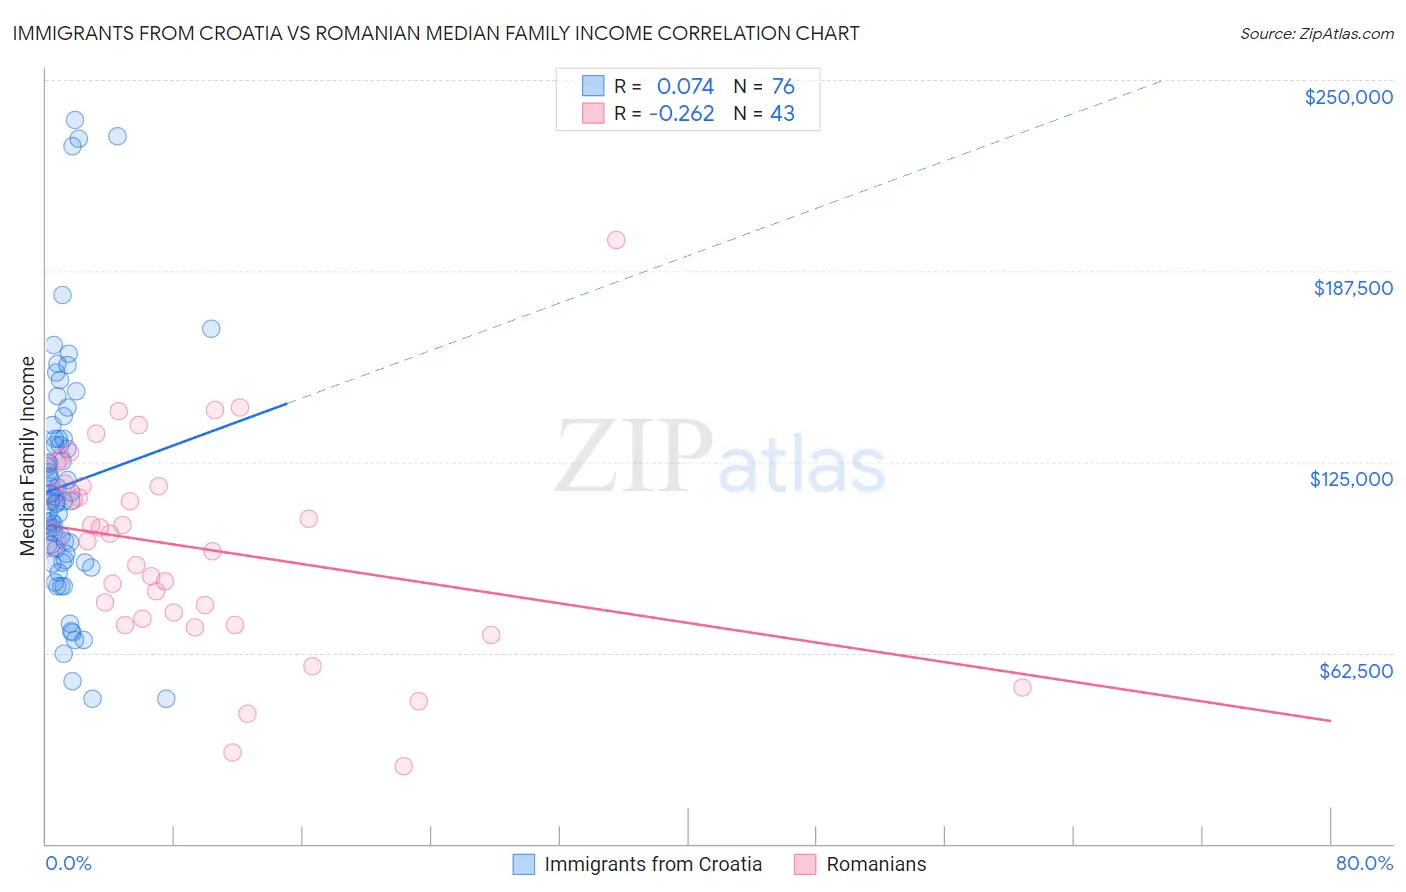
Immigrants from Croatia vs Romanian Median Family Income Correlation Chart
The statistical analysis conducted on geographies consisting of 132,566,402 people shows a slight positive correlation between the proportion of Immigrants from Croatia and median family income in the United States with a correlation coefficient (R) of 0.074 and weighted average of $112,323. Similarly, the statistical analysis conducted on geographies consisting of 377,611,628 people shows a weak negative correlation between the proportion of Romanians and median family income in the United States with a correlation coefficient (R) of -0.262 and weighted average of $111,243, a difference of 0.97%.
Median Family Income Correlation Summary
| Measurement | Immigrants from Croatia | Romanian |
| Minimum | $47,321 | $25,417 |
| Maximum | $236,888 | $197,500 |
| Range | $189,567 | $172,083 |
| Mean | $117,325 | $96,934 |
| Median | $112,019 | $100,017 |
| Interquartile 25% (IQ1) | $93,889 | $73,551 |
| Interquartile 75% (IQ3) | $132,485 | $117,024 |
| Interquartile Range (IQR) | $38,596 | $43,473 |
| Standard Deviation (Sample) | $39,118 | $33,876 |
| Standard Deviation (Population) | $38,860 | $33,480 |
Demographics Similar to Immigrants from Croatia and Romanians by Median Family Income
In terms of median family income, the demographic groups most similar to Immigrants from Croatia are Italian ($112,372, a difference of 0.040%), Immigrants from Canada ($112,374, a difference of 0.050%), Immigrants from North America ($112,151, a difference of 0.15%), Immigrants from Eastern Europe ($112,527, a difference of 0.18%), and Immigrants from England ($112,038, a difference of 0.25%). Similarly, the demographic groups most similar to Romanians are Austrian ($111,306, a difference of 0.060%), Croatian ($111,370, a difference of 0.11%), Ukrainian ($111,368, a difference of 0.11%), Immigrants from Hungary ($111,378, a difference of 0.12%), and Immigrants from Argentina ($110,873, a difference of 0.33%).
| Demographics | Rating | Rank | Median Family Income |
| Immigrants | Italy | 99.4 /100 | #74 | Exceptional $112,848 |
| Immigrants | Western Europe | 99.4 /100 | #75 | Exceptional $112,688 |
| Argentineans | 99.4 /100 | #76 | Exceptional $112,665 |
| Immigrants | Eastern Europe | 99.4 /100 | #77 | Exceptional $112,527 |
| Immigrants | Canada | 99.3 /100 | #78 | Exceptional $112,374 |
| Italians | 99.3 /100 | #79 | Exceptional $112,372 |
| Immigrants | Croatia | 99.3 /100 | #80 | Exceptional $112,323 |
| Immigrants | North America | 99.2 /100 | #81 | Exceptional $112,151 |
| Immigrants | England | 99.2 /100 | #82 | Exceptional $112,038 |
| Immigrants | Egypt | 99.0 /100 | #83 | Exceptional $111,689 |
| Immigrants | Hungary | 98.8 /100 | #84 | Exceptional $111,378 |
| Croatians | 98.8 /100 | #85 | Exceptional $111,370 |
| Ukrainians | 98.8 /100 | #86 | Exceptional $111,368 |
| Austrians | 98.8 /100 | #87 | Exceptional $111,306 |
| Romanians | 98.8 /100 | #88 | Exceptional $111,243 |
| Immigrants | Argentina | 98.5 /100 | #89 | Exceptional $110,873 |
| Northern Europeans | 98.3 /100 | #90 | Exceptional $110,635 |
| Immigrants | Southern Europe | 98.3 /100 | #91 | Exceptional $110,614 |
| Immigrants | Lebanon | 97.9 /100 | #92 | Exceptional $110,159 |
| Immigrants | Kazakhstan | 97.8 /100 | #93 | Exceptional $110,137 |
| Koreans | 97.8 /100 | #94 | Exceptional $110,103 |