Immigrants from Costa Rica vs Filipino Median Male Earnings
COMPARE
Immigrants from Costa Rica
Filipino
Median Male Earnings
Median Male Earnings Comparison
Immigrants from Costa Rica
Filipinos
$53,237
MEDIAN MALE EARNINGS
22.6/ 100
METRIC RATING
198th/ 347
METRIC RANK
$74,224
MEDIAN MALE EARNINGS
100.0/ 100
METRIC RATING
1st/ 347
METRIC RANK
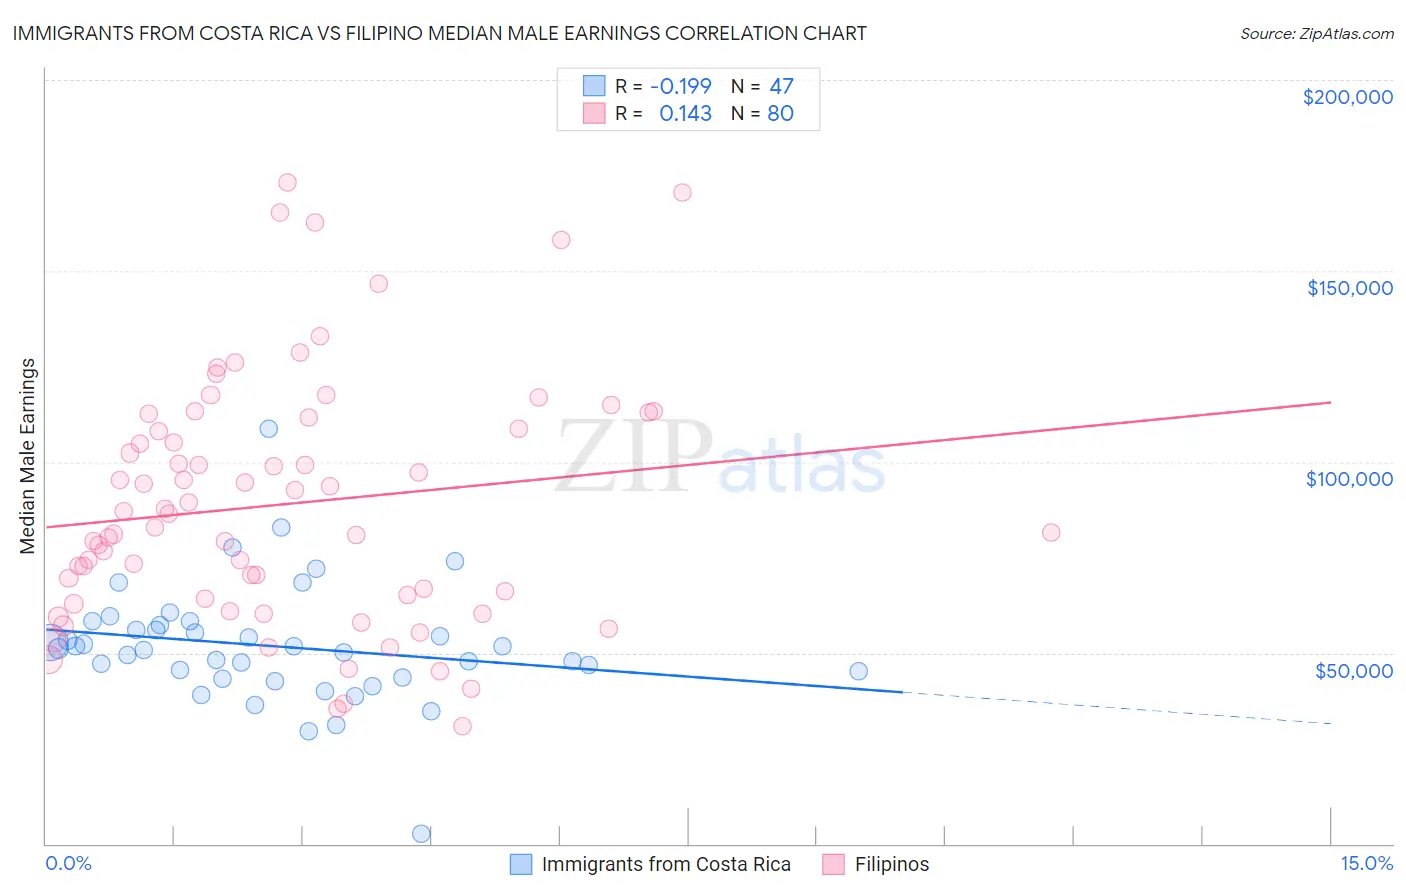
Immigrants from Costa Rica vs Filipino Median Male Earnings Correlation Chart
The statistical analysis conducted on geographies consisting of 204,258,977 people shows a poor negative correlation between the proportion of Immigrants from Costa Rica and median male earnings in the United States with a correlation coefficient (R) of -0.199 and weighted average of $53,237. Similarly, the statistical analysis conducted on geographies consisting of 254,342,119 people shows a poor positive correlation between the proportion of Filipinos and median male earnings in the United States with a correlation coefficient (R) of 0.143 and weighted average of $74,224, a difference of 39.4%.
Median Male Earnings Correlation Summary
| Measurement | Immigrants from Costa Rica | Filipino |
| Minimum | $2,499 | $30,694 |
| Maximum | $108,694 | $173,150 |
| Range | $106,195 | $142,456 |
| Mean | $51,781 | $88,887 |
| Median | $51,130 | $84,592 |
| Interquartile 25% (IQ1) | $43,645 | $64,781 |
| Interquartile 75% (IQ3) | $57,328 | $110,251 |
| Interquartile Range (IQR) | $13,682 | $45,470 |
| Standard Deviation (Sample) | $15,839 | $32,365 |
| Standard Deviation (Population) | $15,669 | $32,162 |
Similar Demographics by Median Male Earnings
Demographics Similar to Immigrants from Costa Rica by Median Male Earnings
In terms of median male earnings, the demographic groups most similar to Immigrants from Costa Rica are Tongan ($53,218, a difference of 0.030%), Immigrants from Kenya ($53,427, a difference of 0.36%), Immigrants from Africa ($53,457, a difference of 0.41%), Immigrants from the Azores ($53,503, a difference of 0.50%), and Immigrants from Thailand ($52,908, a difference of 0.62%).
| Demographics | Rating | Rank | Median Male Earnings |
| Guamanians/Chamorros | 30.7 /100 | #191 | Fair $53,661 |
| Scotch-Irish | 30.6 /100 | #192 | Fair $53,658 |
| Kenyans | 30.4 /100 | #193 | Fair $53,647 |
| Spanish | 29.0 /100 | #194 | Fair $53,576 |
| Immigrants | Azores | 27.5 /100 | #195 | Fair $53,503 |
| Immigrants | Africa | 26.6 /100 | #196 | Fair $53,457 |
| Immigrants | Kenya | 26.0 /100 | #197 | Fair $53,427 |
| Immigrants | Costa Rica | 22.6 /100 | #198 | Fair $53,237 |
| Tongans | 22.3 /100 | #199 | Fair $53,218 |
| Immigrants | Thailand | 17.5 /100 | #200 | Poor $52,908 |
| Immigrants | Bosnia and Herzegovina | 16.9 /100 | #201 | Poor $52,869 |
| Immigrants | Uruguay | 16.8 /100 | #202 | Poor $52,860 |
| Panamanians | 16.5 /100 | #203 | Poor $52,835 |
| Ghanaians | 16.1 /100 | #204 | Poor $52,810 |
| Immigrants | Colombia | 15.0 /100 | #205 | Poor $52,725 |
Demographics Similar to Filipinos by Median Male Earnings
In terms of median male earnings, the demographic groups most similar to Filipinos are Immigrants from India ($74,207, a difference of 0.020%), Immigrants from Taiwan ($74,031, a difference of 0.26%), Thai ($72,135, a difference of 2.9%), Immigrants from Singapore ($71,348, a difference of 4.0%), and Iranian ($70,648, a difference of 5.1%).
| Demographics | Rating | Rank | Median Male Earnings |
| Filipinos | 100.0 /100 | #1 | Exceptional $74,224 |
| Immigrants | India | 100.0 /100 | #2 | Exceptional $74,207 |
| Immigrants | Taiwan | 100.0 /100 | #3 | Exceptional $74,031 |
| Thais | 100.0 /100 | #4 | Exceptional $72,135 |
| Immigrants | Singapore | 100.0 /100 | #5 | Exceptional $71,348 |
| Iranians | 100.0 /100 | #6 | Exceptional $70,648 |
| Immigrants | Hong Kong | 100.0 /100 | #7 | Exceptional $70,146 |
| Immigrants | Iran | 100.0 /100 | #8 | Exceptional $69,284 |
| Immigrants | South Central Asia | 100.0 /100 | #9 | Exceptional $68,960 |
| Immigrants | Israel | 100.0 /100 | #10 | Exceptional $68,716 |
| Immigrants | Ireland | 100.0 /100 | #11 | Exceptional $67,698 |
| Immigrants | Australia | 100.0 /100 | #12 | Exceptional $67,634 |
| Immigrants | China | 100.0 /100 | #13 | Exceptional $67,353 |
| Okinawans | 100.0 /100 | #14 | Exceptional $67,232 |
| Immigrants | Eastern Asia | 100.0 /100 | #15 | Exceptional $66,903 |