Immigrants from Costa Rica vs Estonian Median Male Earnings
COMPARE
Immigrants from Costa Rica
Estonian
Median Male Earnings
Median Male Earnings Comparison
Immigrants from Costa Rica
Estonians
$53,237
MEDIAN MALE EARNINGS
22.6/ 100
METRIC RATING
198th/ 347
METRIC RANK
$61,710
MEDIAN MALE EARNINGS
99.9/ 100
METRIC RATING
51st/ 347
METRIC RANK
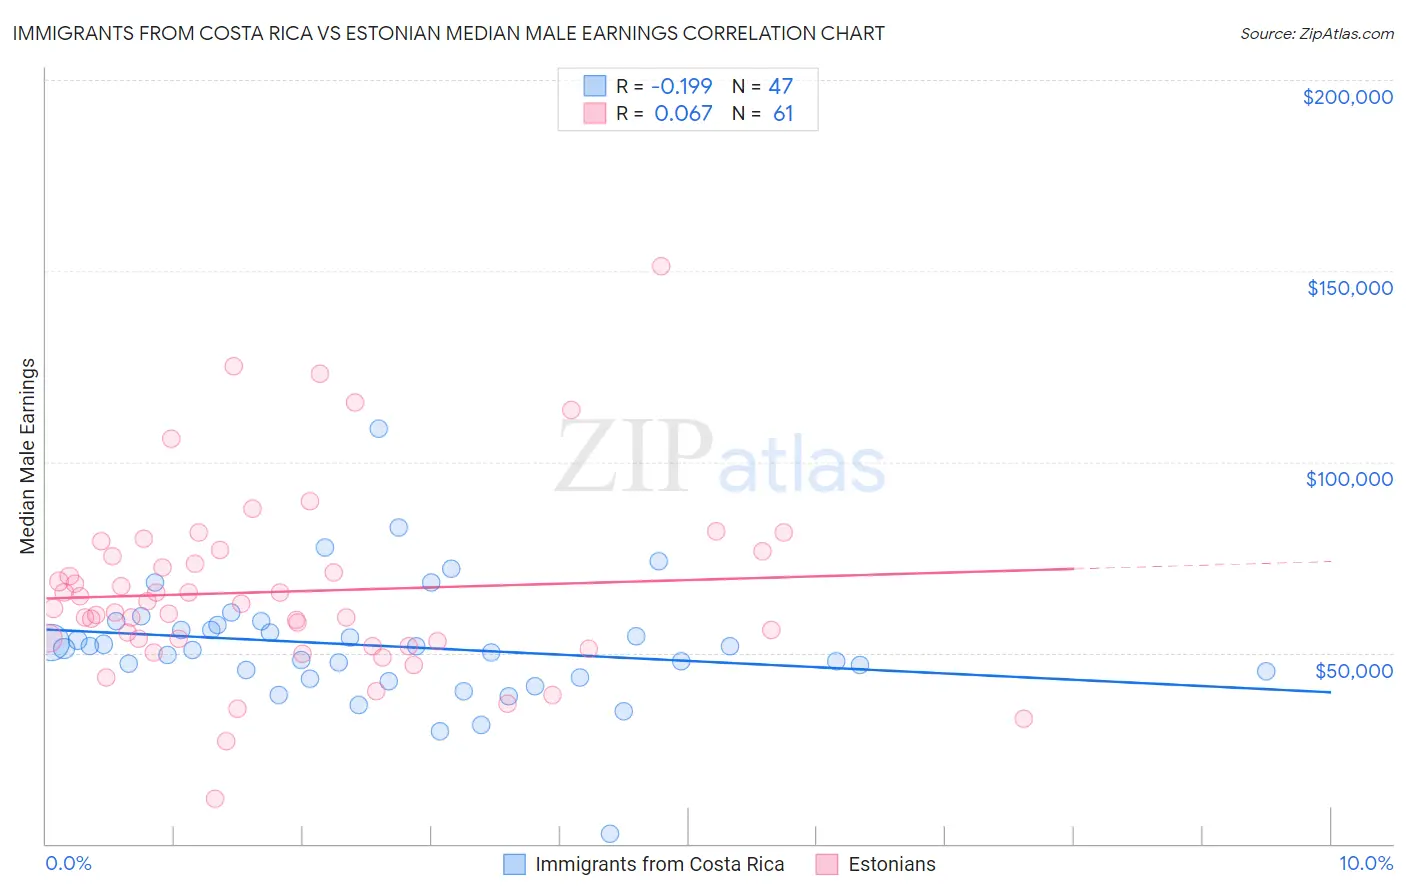
Immigrants from Costa Rica vs Estonian Median Male Earnings Correlation Chart
The statistical analysis conducted on geographies consisting of 204,258,977 people shows a poor negative correlation between the proportion of Immigrants from Costa Rica and median male earnings in the United States with a correlation coefficient (R) of -0.199 and weighted average of $53,237. Similarly, the statistical analysis conducted on geographies consisting of 123,512,238 people shows a slight positive correlation between the proportion of Estonians and median male earnings in the United States with a correlation coefficient (R) of 0.067 and weighted average of $61,710, a difference of 15.9%.
Median Male Earnings Correlation Summary
| Measurement | Immigrants from Costa Rica | Estonian |
| Minimum | $2,499 | $11,700 |
| Maximum | $108,694 | $151,311 |
| Range | $106,195 | $139,611 |
| Mean | $51,781 | $66,018 |
| Median | $51,130 | $61,673 |
| Interquartile 25% (IQ1) | $43,645 | $52,472 |
| Interquartile 75% (IQ3) | $57,328 | $76,012 |
| Interquartile Range (IQR) | $13,682 | $23,541 |
| Standard Deviation (Sample) | $15,839 | $24,287 |
| Standard Deviation (Population) | $15,669 | $24,087 |
Similar Demographics by Median Male Earnings
Demographics Similar to Immigrants from Costa Rica by Median Male Earnings
In terms of median male earnings, the demographic groups most similar to Immigrants from Costa Rica are Tongan ($53,218, a difference of 0.030%), Immigrants from Kenya ($53,427, a difference of 0.36%), Immigrants from Africa ($53,457, a difference of 0.41%), Immigrants from the Azores ($53,503, a difference of 0.50%), and Immigrants from Thailand ($52,908, a difference of 0.62%).
| Demographics | Rating | Rank | Median Male Earnings |
| Guamanians/Chamorros | 30.7 /100 | #191 | Fair $53,661 |
| Scotch-Irish | 30.6 /100 | #192 | Fair $53,658 |
| Kenyans | 30.4 /100 | #193 | Fair $53,647 |
| Spanish | 29.0 /100 | #194 | Fair $53,576 |
| Immigrants | Azores | 27.5 /100 | #195 | Fair $53,503 |
| Immigrants | Africa | 26.6 /100 | #196 | Fair $53,457 |
| Immigrants | Kenya | 26.0 /100 | #197 | Fair $53,427 |
| Immigrants | Costa Rica | 22.6 /100 | #198 | Fair $53,237 |
| Tongans | 22.3 /100 | #199 | Fair $53,218 |
| Immigrants | Thailand | 17.5 /100 | #200 | Poor $52,908 |
| Immigrants | Bosnia and Herzegovina | 16.9 /100 | #201 | Poor $52,869 |
| Immigrants | Uruguay | 16.8 /100 | #202 | Poor $52,860 |
| Panamanians | 16.5 /100 | #203 | Poor $52,835 |
| Ghanaians | 16.1 /100 | #204 | Poor $52,810 |
| Immigrants | Colombia | 15.0 /100 | #205 | Poor $52,725 |
Demographics Similar to Estonians by Median Male Earnings
In terms of median male earnings, the demographic groups most similar to Estonians are Bhutanese ($61,759, a difference of 0.080%), Immigrants from Norway ($61,628, a difference of 0.13%), South African ($61,460, a difference of 0.41%), Immigrants from Latvia ($61,422, a difference of 0.47%), and Immigrants from Europe ($62,057, a difference of 0.56%).
| Demographics | Rating | Rank | Median Male Earnings |
| Cambodians | 100.0 /100 | #44 | Exceptional $62,516 |
| Bulgarians | 100.0 /100 | #45 | Exceptional $62,378 |
| Immigrants | Czechoslovakia | 99.9 /100 | #46 | Exceptional $62,217 |
| Immigrants | Austria | 99.9 /100 | #47 | Exceptional $62,164 |
| Immigrants | Malaysia | 99.9 /100 | #48 | Exceptional $62,121 |
| Immigrants | Europe | 99.9 /100 | #49 | Exceptional $62,057 |
| Bhutanese | 99.9 /100 | #50 | Exceptional $61,759 |
| Estonians | 99.9 /100 | #51 | Exceptional $61,710 |
| Immigrants | Norway | 99.9 /100 | #52 | Exceptional $61,628 |
| South Africans | 99.9 /100 | #53 | Exceptional $61,460 |
| Immigrants | Latvia | 99.9 /100 | #54 | Exceptional $61,422 |
| Greeks | 99.9 /100 | #55 | Exceptional $61,242 |
| Lithuanians | 99.9 /100 | #56 | Exceptional $61,228 |
| Immigrants | Scotland | 99.9 /100 | #57 | Exceptional $61,220 |
| New Zealanders | 99.9 /100 | #58 | Exceptional $61,199 |