Immigrants from Costa Rica vs Immigrants from Sri Lanka In Labor Force | Age 25-29
COMPARE
Immigrants from Costa Rica
Immigrants from Sri Lanka
In Labor Force | Age 25-29
In Labor Force | Age 25-29 Comparison
Immigrants from Costa Rica
Immigrants from Sri Lanka
85.1%
IN LABOR FORCE | AGE 25-29
95.5/ 100
METRIC RATING
92nd/ 347
METRIC RANK
84.7%
IN LABOR FORCE | AGE 25-29
61.7/ 100
METRIC RATING
154th/ 347
METRIC RANK
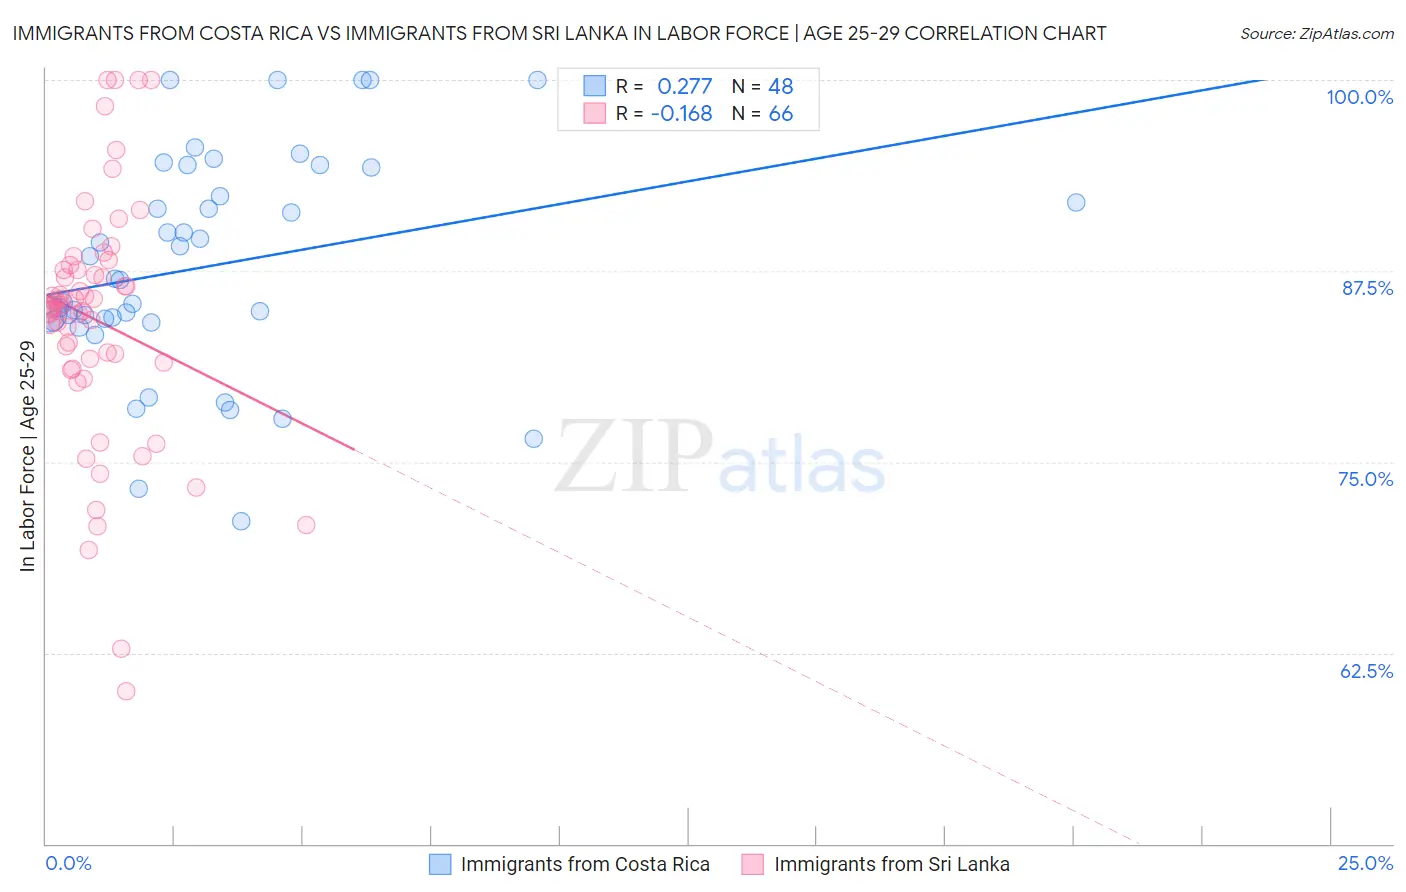
Immigrants from Costa Rica vs Immigrants from Sri Lanka In Labor Force | Age 25-29 Correlation Chart
The statistical analysis conducted on geographies consisting of 204,268,697 people shows a weak positive correlation between the proportion of Immigrants from Costa Rica and labor force participation rate among population between the ages 25 and 29 in the United States with a correlation coefficient (R) of 0.277 and weighted average of 85.1%. Similarly, the statistical analysis conducted on geographies consisting of 149,692,146 people shows a poor negative correlation between the proportion of Immigrants from Sri Lanka and labor force participation rate among population between the ages 25 and 29 in the United States with a correlation coefficient (R) of -0.168 and weighted average of 84.7%, a difference of 0.48%.
In Labor Force | Age 25-29 Correlation Summary
| Measurement | Immigrants from Costa Rica | Immigrants from Sri Lanka |
| Minimum | 71.1% | 60.0% |
| Maximum | 100.0% | 100.0% |
| Range | 28.9% | 40.0% |
| Mean | 87.8% | 84.3% |
| Median | 86.9% | 85.2% |
| Interquartile 25% (IQ1) | 84.3% | 81.5% |
| Interquartile 75% (IQ3) | 93.3% | 87.6% |
| Interquartile Range (IQR) | 9.0% | 6.1% |
| Standard Deviation (Sample) | 7.1% | 8.0% |
| Standard Deviation (Population) | 7.1% | 7.9% |
Similar Demographics by In Labor Force | Age 25-29
Demographics Similar to Immigrants from Costa Rica by In Labor Force | Age 25-29
In terms of in labor force | age 25-29, the demographic groups most similar to Immigrants from Costa Rica are Immigrants from Moldova (85.1%, a difference of 0.010%), Austrian (85.1%, a difference of 0.010%), Burmese (85.1%, a difference of 0.020%), Immigrants from Korea (85.1%, a difference of 0.030%), and Immigrants from Croatia (85.2%, a difference of 0.040%).
| Demographics | Rating | Rank | In Labor Force | Age 25-29 |
| Immigrants | Africa | 96.7 /100 | #85 | Exceptional 85.2% |
| Ukrainians | 96.7 /100 | #86 | Exceptional 85.2% |
| French Canadians | 96.5 /100 | #87 | Exceptional 85.2% |
| Immigrants | Croatia | 96.4 /100 | #88 | Exceptional 85.2% |
| Immigrants | France | 96.3 /100 | #89 | Exceptional 85.2% |
| Burmese | 95.9 /100 | #90 | Exceptional 85.1% |
| Immigrants | Moldova | 95.8 /100 | #91 | Exceptional 85.1% |
| Immigrants | Costa Rica | 95.5 /100 | #92 | Exceptional 85.1% |
| Austrians | 95.3 /100 | #93 | Exceptional 85.1% |
| Immigrants | Korea | 94.8 /100 | #94 | Exceptional 85.1% |
| Immigrants | Netherlands | 94.6 /100 | #95 | Exceptional 85.1% |
| Immigrants | Romania | 94.6 /100 | #96 | Exceptional 85.1% |
| Immigrants | Sudan | 94.3 /100 | #97 | Exceptional 85.1% |
| Mongolians | 94.1 /100 | #98 | Exceptional 85.1% |
| Bangladeshis | 94.0 /100 | #99 | Exceptional 85.1% |
Demographics Similar to Immigrants from Sri Lanka by In Labor Force | Age 25-29
In terms of in labor force | age 25-29, the demographic groups most similar to Immigrants from Sri Lanka are Immigrants from Taiwan (84.7%, a difference of 0.0%), Indian (Asian) (84.7%, a difference of 0.0%), French (84.7%, a difference of 0.0%), Colombian (84.7%, a difference of 0.010%), and Immigrants from Pakistan (84.7%, a difference of 0.010%).
| Demographics | Rating | Rank | In Labor Force | Age 25-29 |
| Immigrants | Asia | 68.2 /100 | #147 | Good 84.8% |
| Immigrants | England | 65.2 /100 | #148 | Good 84.7% |
| Peruvians | 64.7 /100 | #149 | Good 84.7% |
| Swiss | 64.7 /100 | #150 | Good 84.7% |
| Colombians | 62.8 /100 | #151 | Good 84.7% |
| Immigrants | Pakistan | 62.7 /100 | #152 | Good 84.7% |
| Immigrants | Taiwan | 62.2 /100 | #153 | Good 84.7% |
| Immigrants | Sri Lanka | 61.7 /100 | #154 | Good 84.7% |
| Indians (Asian) | 61.6 /100 | #155 | Good 84.7% |
| French | 61.0 /100 | #156 | Good 84.7% |
| British | 60.4 /100 | #157 | Good 84.7% |
| Immigrants | Ghana | 60.2 /100 | #158 | Good 84.7% |
| Immigrants | Western Africa | 60.1 /100 | #159 | Good 84.7% |
| Immigrants | Peru | 58.6 /100 | #160 | Average 84.7% |
| Canadians | 58.5 /100 | #161 | Average 84.7% |