Immigrants from Costa Rica vs Filipino Per Capita Income
COMPARE
Immigrants from Costa Rica
Filipino
Per Capita Income
Per Capita Income Comparison
Immigrants from Costa Rica
Filipinos
$43,464
PER CAPITA INCOME
44.5/ 100
METRIC RATING
178th/ 347
METRIC RANK
$59,066
PER CAPITA INCOME
100.0/ 100
METRIC RATING
1st/ 347
METRIC RANK
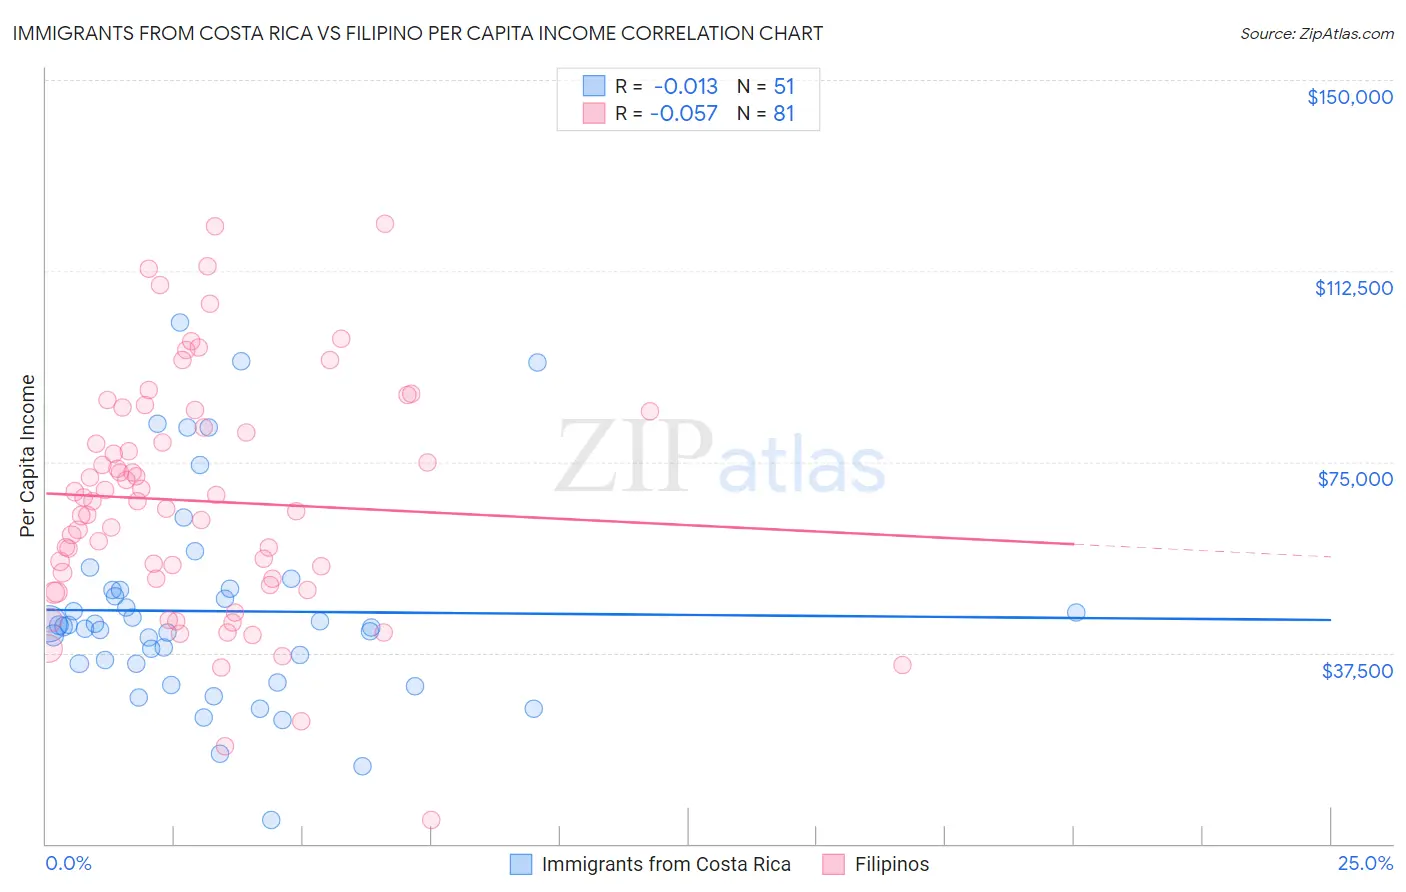
Immigrants from Costa Rica vs Filipino Per Capita Income Correlation Chart
The statistical analysis conducted on geographies consisting of 204,277,265 people shows no correlation between the proportion of Immigrants from Costa Rica and per capita income in the United States with a correlation coefficient (R) of -0.013 and weighted average of $43,464. Similarly, the statistical analysis conducted on geographies consisting of 254,359,894 people shows a slight negative correlation between the proportion of Filipinos and per capita income in the United States with a correlation coefficient (R) of -0.057 and weighted average of $59,066, a difference of 35.9%.
Per Capita Income Correlation Summary
| Measurement | Immigrants from Costa Rica | Filipino |
| Minimum | $4,614 | $4,657 |
| Maximum | $102,492 | $121,798 |
| Range | $97,878 | $117,141 |
| Mean | $45,686 | $67,314 |
| Median | $42,626 | $67,249 |
| Interquartile 25% (IQ1) | $35,269 | $51,364 |
| Interquartile 75% (IQ3) | $49,864 | $83,421 |
| Interquartile Range (IQR) | $14,595 | $32,057 |
| Standard Deviation (Sample) | $20,176 | $23,294 |
| Standard Deviation (Population) | $19,977 | $23,149 |
Similar Demographics by Per Capita Income
Demographics Similar to Immigrants from Costa Rica by Per Capita Income
In terms of per capita income, the demographic groups most similar to Immigrants from Costa Rica are Finnish ($43,461, a difference of 0.010%), Tlingit-Haida ($43,516, a difference of 0.12%), Sierra Leonean ($43,405, a difference of 0.14%), Immigrants from South Eastern Asia ($43,539, a difference of 0.17%), and Celtic ($43,621, a difference of 0.36%).
| Demographics | Rating | Rank | Per Capita Income |
| Immigrants | Eastern Africa | 54.9 /100 | #171 | Average $43,838 |
| Czechoslovakians | 54.1 /100 | #172 | Average $43,806 |
| French | 50.7 /100 | #173 | Average $43,685 |
| Colombians | 50.0 /100 | #174 | Average $43,661 |
| Celtics | 48.9 /100 | #175 | Average $43,621 |
| Immigrants | South Eastern Asia | 46.6 /100 | #176 | Average $43,539 |
| Tlingit-Haida | 45.9 /100 | #177 | Average $43,516 |
| Immigrants | Costa Rica | 44.5 /100 | #178 | Average $43,464 |
| Finns | 44.4 /100 | #179 | Average $43,461 |
| Sierra Leoneans | 42.9 /100 | #180 | Average $43,405 |
| Welsh | 38.2 /100 | #181 | Fair $43,233 |
| Immigrants | Vietnam | 38.1 /100 | #182 | Fair $43,229 |
| Germans | 33.9 /100 | #183 | Fair $43,067 |
| Spaniards | 32.9 /100 | #184 | Fair $43,028 |
| Immigrants | Immigrants | 32.5 /100 | #185 | Fair $43,010 |
Demographics Similar to Filipinos by Per Capita Income
In terms of per capita income, the demographic groups most similar to Filipinos are Iranian ($58,786, a difference of 0.48%), Immigrants from Singapore ($58,353, a difference of 1.2%), Immigrants from Australia ($57,953, a difference of 1.9%), Immigrants from Iran ($57,759, a difference of 2.3%), and Immigrants from Taiwan ($57,742, a difference of 2.3%).
| Demographics | Rating | Rank | Per Capita Income |
| Filipinos | 100.0 /100 | #1 | Exceptional $59,066 |
| Iranians | 100.0 /100 | #2 | Exceptional $58,786 |
| Immigrants | Singapore | 100.0 /100 | #3 | Exceptional $58,353 |
| Immigrants | Australia | 100.0 /100 | #4 | Exceptional $57,953 |
| Immigrants | Iran | 100.0 /100 | #5 | Exceptional $57,759 |
| Immigrants | Taiwan | 100.0 /100 | #6 | Exceptional $57,742 |
| Immigrants | Israel | 100.0 /100 | #7 | Exceptional $57,384 |
| Immigrants | Hong Kong | 100.0 /100 | #8 | Exceptional $56,709 |
| Immigrants | Ireland | 100.0 /100 | #9 | Exceptional $56,584 |
| Okinawans | 100.0 /100 | #10 | Exceptional $55,817 |
| Eastern Europeans | 100.0 /100 | #11 | Exceptional $55,780 |
| Immigrants | Sweden | 100.0 /100 | #12 | Exceptional $55,582 |
| Immigrants | India | 100.0 /100 | #13 | Exceptional $55,268 |
| Immigrants | Belgium | 100.0 /100 | #14 | Exceptional $55,082 |
| Cypriots | 100.0 /100 | #15 | Exceptional $54,899 |