Cuban vs Filipino Per Capita Income
COMPARE
Cuban
Filipino
Per Capita Income
Per Capita Income Comparison
Cubans
Filipinos
$37,383
PER CAPITA INCOME
0.1/ 100
METRIC RATING
294th/ 347
METRIC RANK
$59,066
PER CAPITA INCOME
100.0/ 100
METRIC RATING
1st/ 347
METRIC RANK
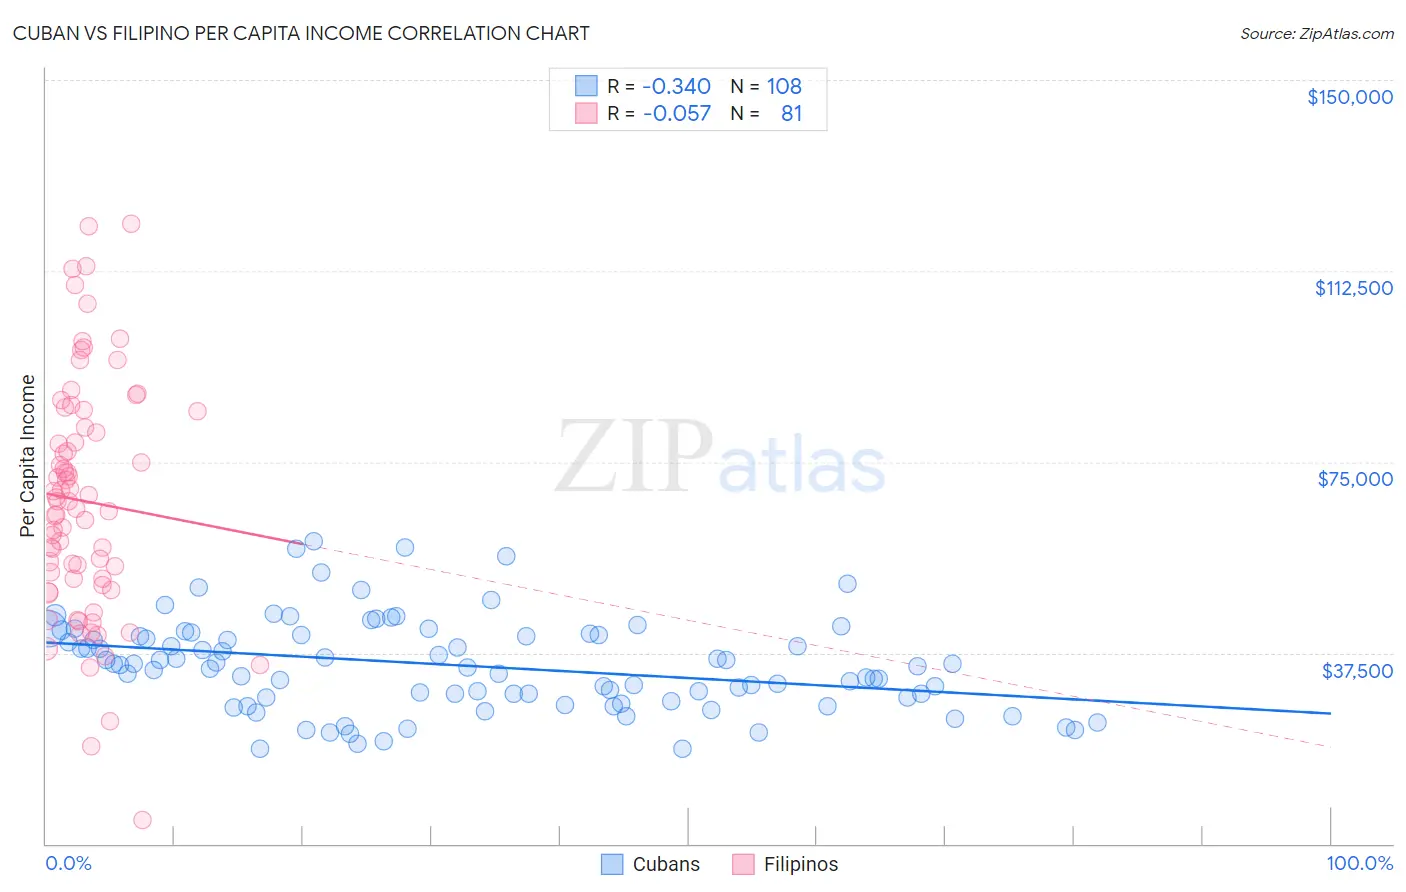
Cuban vs Filipino Per Capita Income Correlation Chart
The statistical analysis conducted on geographies consisting of 449,330,794 people shows a mild negative correlation between the proportion of Cubans and per capita income in the United States with a correlation coefficient (R) of -0.340 and weighted average of $37,383. Similarly, the statistical analysis conducted on geographies consisting of 254,359,894 people shows a slight negative correlation between the proportion of Filipinos and per capita income in the United States with a correlation coefficient (R) of -0.057 and weighted average of $59,066, a difference of 58.0%.
Per Capita Income Correlation Summary
| Measurement | Cuban | Filipino |
| Minimum | $18,566 | $4,657 |
| Maximum | $59,513 | $121,798 |
| Range | $40,947 | $117,141 |
| Mean | $35,073 | $67,314 |
| Median | $35,004 | $67,249 |
| Interquartile 25% (IQ1) | $28,628 | $51,364 |
| Interquartile 75% (IQ3) | $40,960 | $83,421 |
| Interquartile Range (IQR) | $12,332 | $32,057 |
| Standard Deviation (Sample) | $9,056 | $23,294 |
| Standard Deviation (Population) | $9,014 | $23,149 |
Similar Demographics by Per Capita Income
Demographics Similar to Cubans by Per Capita Income
In terms of per capita income, the demographic groups most similar to Cubans are Mexican American Indian ($37,407, a difference of 0.070%), Immigrants from Dominican Republic ($37,306, a difference of 0.21%), Immigrants from Micronesia ($37,464, a difference of 0.22%), Indonesian ($37,300, a difference of 0.22%), and Haitian ($37,289, a difference of 0.25%).
| Demographics | Rating | Rank | Per Capita Income |
| Dominicans | 0.1 /100 | #287 | Tragic $37,697 |
| Blackfeet | 0.1 /100 | #288 | Tragic $37,695 |
| U.S. Virgin Islanders | 0.1 /100 | #289 | Tragic $37,589 |
| Immigrants | Guatemala | 0.1 /100 | #290 | Tragic $37,550 |
| Cajuns | 0.1 /100 | #291 | Tragic $37,527 |
| Immigrants | Micronesia | 0.1 /100 | #292 | Tragic $37,464 |
| Mexican American Indians | 0.1 /100 | #293 | Tragic $37,407 |
| Cubans | 0.1 /100 | #294 | Tragic $37,383 |
| Immigrants | Dominican Republic | 0.1 /100 | #295 | Tragic $37,306 |
| Indonesians | 0.1 /100 | #296 | Tragic $37,300 |
| Haitians | 0.1 /100 | #297 | Tragic $37,289 |
| Immigrants | Caribbean | 0.1 /100 | #298 | Tragic $37,254 |
| Cherokee | 0.1 /100 | #299 | Tragic $37,203 |
| Immigrants | Bahamas | 0.1 /100 | #300 | Tragic $37,193 |
| Ottawa | 0.1 /100 | #301 | Tragic $37,101 |
Demographics Similar to Filipinos by Per Capita Income
In terms of per capita income, the demographic groups most similar to Filipinos are Iranian ($58,786, a difference of 0.48%), Immigrants from Singapore ($58,353, a difference of 1.2%), Immigrants from Australia ($57,953, a difference of 1.9%), Immigrants from Iran ($57,759, a difference of 2.3%), and Immigrants from Taiwan ($57,742, a difference of 2.3%).
| Demographics | Rating | Rank | Per Capita Income |
| Filipinos | 100.0 /100 | #1 | Exceptional $59,066 |
| Iranians | 100.0 /100 | #2 | Exceptional $58,786 |
| Immigrants | Singapore | 100.0 /100 | #3 | Exceptional $58,353 |
| Immigrants | Australia | 100.0 /100 | #4 | Exceptional $57,953 |
| Immigrants | Iran | 100.0 /100 | #5 | Exceptional $57,759 |
| Immigrants | Taiwan | 100.0 /100 | #6 | Exceptional $57,742 |
| Immigrants | Israel | 100.0 /100 | #7 | Exceptional $57,384 |
| Immigrants | Hong Kong | 100.0 /100 | #8 | Exceptional $56,709 |
| Immigrants | Ireland | 100.0 /100 | #9 | Exceptional $56,584 |
| Okinawans | 100.0 /100 | #10 | Exceptional $55,817 |
| Eastern Europeans | 100.0 /100 | #11 | Exceptional $55,780 |
| Immigrants | Sweden | 100.0 /100 | #12 | Exceptional $55,582 |
| Immigrants | India | 100.0 /100 | #13 | Exceptional $55,268 |
| Immigrants | Belgium | 100.0 /100 | #14 | Exceptional $55,082 |
| Cypriots | 100.0 /100 | #15 | Exceptional $54,899 |