Immigrants from Western Europe vs Filipino Per Capita Income
COMPARE
Immigrants from Western Europe
Filipino
Per Capita Income
Per Capita Income Comparison
Immigrants from Western Europe
Filipinos
$50,065
PER CAPITA INCOME
99.9/ 100
METRIC RATING
55th/ 347
METRIC RANK
$59,066
PER CAPITA INCOME
100.0/ 100
METRIC RATING
1st/ 347
METRIC RANK
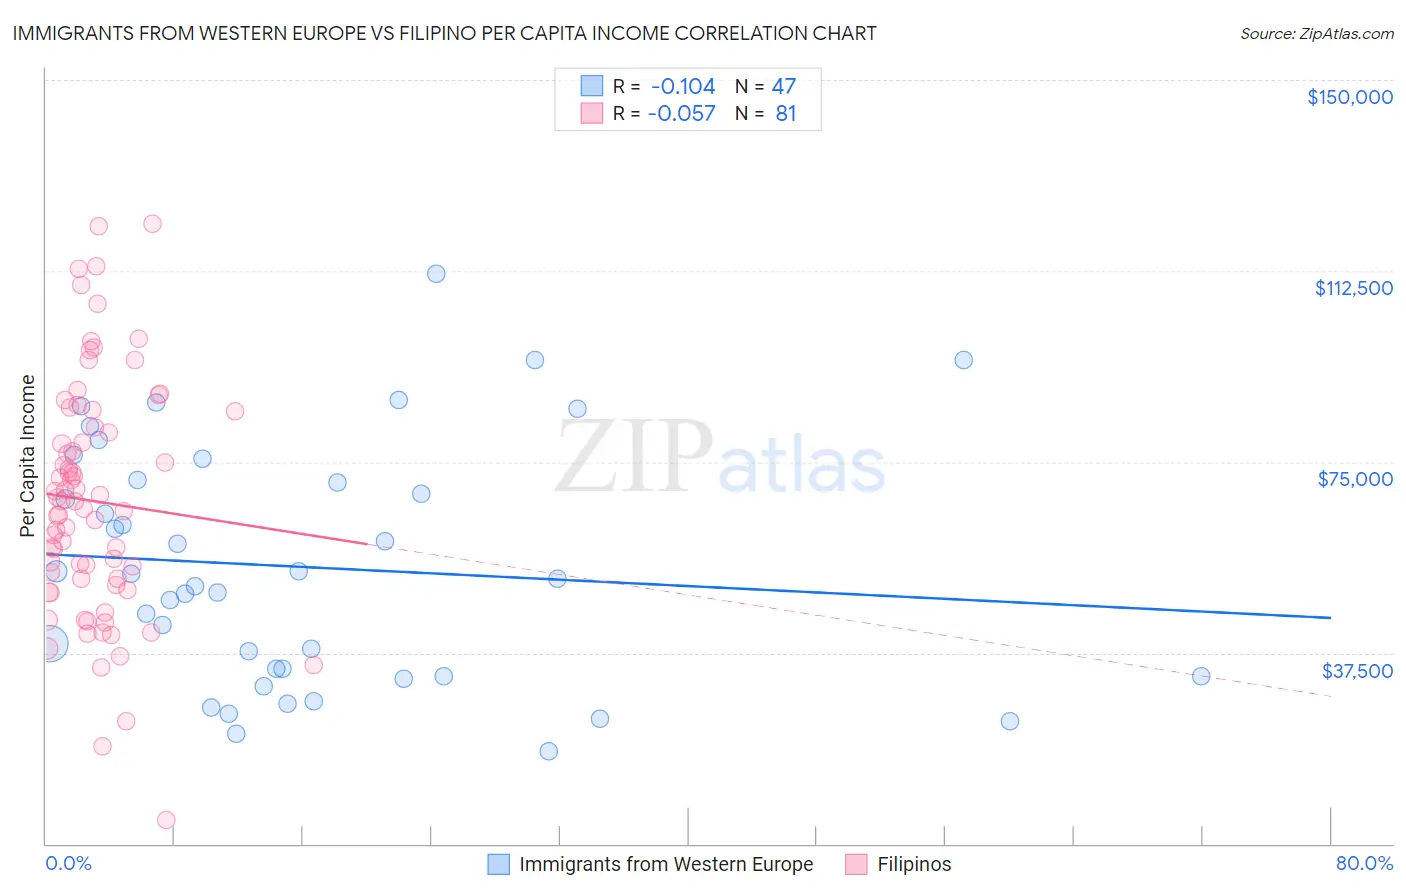
Immigrants from Western Europe vs Filipino Per Capita Income Correlation Chart
The statistical analysis conducted on geographies consisting of 494,094,837 people shows a poor negative correlation between the proportion of Immigrants from Western Europe and per capita income in the United States with a correlation coefficient (R) of -0.104 and weighted average of $50,065. Similarly, the statistical analysis conducted on geographies consisting of 254,359,894 people shows a slight negative correlation between the proportion of Filipinos and per capita income in the United States with a correlation coefficient (R) of -0.057 and weighted average of $59,066, a difference of 18.0%.
Per Capita Income Correlation Summary
| Measurement | Immigrants from Western Europe | Filipino |
| Minimum | $18,269 | $4,657 |
| Maximum | $111,976 | $121,798 |
| Range | $93,707 | $117,141 |
| Mean | $54,316 | $67,314 |
| Median | $51,952 | $67,249 |
| Interquartile 25% (IQ1) | $33,002 | $51,364 |
| Interquartile 75% (IQ3) | $71,320 | $83,421 |
| Interquartile Range (IQR) | $38,319 | $32,057 |
| Standard Deviation (Sample) | $23,455 | $23,294 |
| Standard Deviation (Population) | $23,204 | $23,149 |
Similar Demographics by Per Capita Income
Demographics Similar to Immigrants from Western Europe by Per Capita Income
In terms of per capita income, the demographic groups most similar to Immigrants from Western Europe are Asian ($50,057, a difference of 0.020%), South African ($50,044, a difference of 0.040%), Immigrants from Malaysia ($49,983, a difference of 0.16%), Bhutanese ($49,894, a difference of 0.34%), and Immigrants from Scotland ($49,893, a difference of 0.34%).
| Demographics | Rating | Rank | Per Capita Income |
| Immigrants | Serbia | 100.0 /100 | #48 | Exceptional $50,810 |
| New Zealanders | 100.0 /100 | #49 | Exceptional $50,575 |
| Immigrants | Sri Lanka | 100.0 /100 | #50 | Exceptional $50,555 |
| Immigrants | Netherlands | 100.0 /100 | #51 | Exceptional $50,458 |
| Immigrants | Croatia | 99.9 /100 | #52 | Exceptional $50,417 |
| Paraguayans | 99.9 /100 | #53 | Exceptional $50,385 |
| Immigrants | Belarus | 99.9 /100 | #54 | Exceptional $50,303 |
| Immigrants | Western Europe | 99.9 /100 | #55 | Exceptional $50,065 |
| Asians | 99.9 /100 | #56 | Exceptional $50,057 |
| South Africans | 99.9 /100 | #57 | Exceptional $50,044 |
| Immigrants | Malaysia | 99.9 /100 | #58 | Exceptional $49,983 |
| Bhutanese | 99.9 /100 | #59 | Exceptional $49,894 |
| Immigrants | Scotland | 99.9 /100 | #60 | Exceptional $49,893 |
| Argentineans | 99.9 /100 | #61 | Exceptional $49,862 |
| Immigrants | Asia | 99.9 /100 | #62 | Exceptional $49,741 |
Demographics Similar to Filipinos by Per Capita Income
In terms of per capita income, the demographic groups most similar to Filipinos are Iranian ($58,786, a difference of 0.48%), Immigrants from Singapore ($58,353, a difference of 1.2%), Immigrants from Australia ($57,953, a difference of 1.9%), Immigrants from Iran ($57,759, a difference of 2.3%), and Immigrants from Taiwan ($57,742, a difference of 2.3%).
| Demographics | Rating | Rank | Per Capita Income |
| Filipinos | 100.0 /100 | #1 | Exceptional $59,066 |
| Iranians | 100.0 /100 | #2 | Exceptional $58,786 |
| Immigrants | Singapore | 100.0 /100 | #3 | Exceptional $58,353 |
| Immigrants | Australia | 100.0 /100 | #4 | Exceptional $57,953 |
| Immigrants | Iran | 100.0 /100 | #5 | Exceptional $57,759 |
| Immigrants | Taiwan | 100.0 /100 | #6 | Exceptional $57,742 |
| Immigrants | Israel | 100.0 /100 | #7 | Exceptional $57,384 |
| Immigrants | Hong Kong | 100.0 /100 | #8 | Exceptional $56,709 |
| Immigrants | Ireland | 100.0 /100 | #9 | Exceptional $56,584 |
| Okinawans | 100.0 /100 | #10 | Exceptional $55,817 |
| Eastern Europeans | 100.0 /100 | #11 | Exceptional $55,780 |
| Immigrants | Sweden | 100.0 /100 | #12 | Exceptional $55,582 |
| Immigrants | India | 100.0 /100 | #13 | Exceptional $55,268 |
| Immigrants | Belgium | 100.0 /100 | #14 | Exceptional $55,082 |
| Cypriots | 100.0 /100 | #15 | Exceptional $54,899 |