Immigrants from Costa Rica vs Immigrants from Latin America Per Capita Income
COMPARE
Immigrants from Costa Rica
Immigrants from Latin America
Per Capita Income
Per Capita Income Comparison
Immigrants from Costa Rica
Immigrants from Latin America
$43,464
PER CAPITA INCOME
44.5/ 100
METRIC RATING
178th/ 347
METRIC RANK
$36,823
PER CAPITA INCOME
0.0/ 100
METRIC RATING
307th/ 347
METRIC RANK
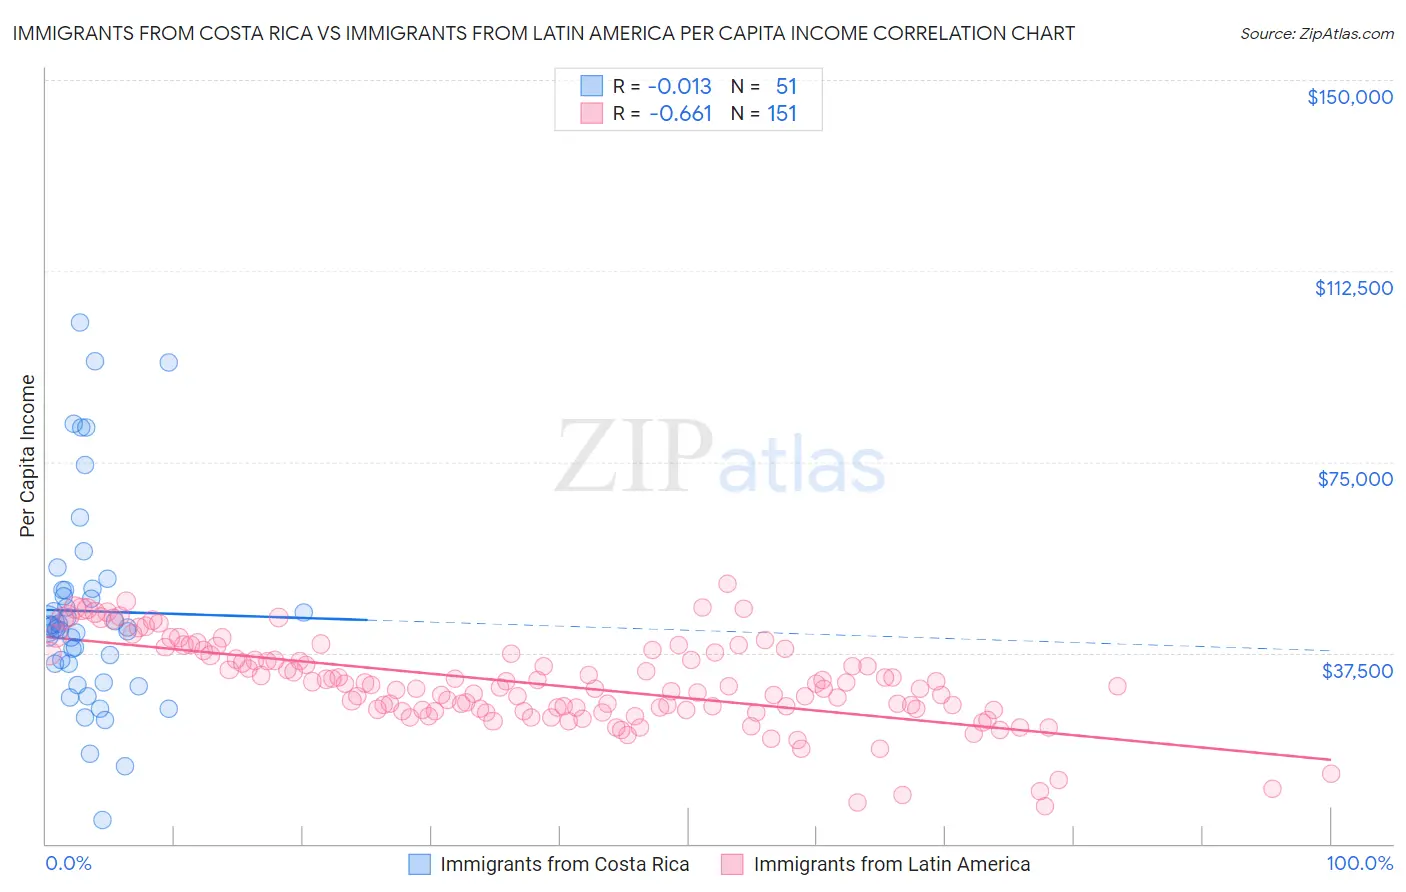
Immigrants from Costa Rica vs Immigrants from Latin America Per Capita Income Correlation Chart
The statistical analysis conducted on geographies consisting of 204,277,265 people shows no correlation between the proportion of Immigrants from Costa Rica and per capita income in the United States with a correlation coefficient (R) of -0.013 and weighted average of $43,464. Similarly, the statistical analysis conducted on geographies consisting of 558,689,902 people shows a significant negative correlation between the proportion of Immigrants from Latin America and per capita income in the United States with a correlation coefficient (R) of -0.661 and weighted average of $36,823, a difference of 18.0%.
Per Capita Income Correlation Summary
| Measurement | Immigrants from Costa Rica | Immigrants from Latin America |
| Minimum | $4,614 | $7,365 |
| Maximum | $102,492 | $51,138 |
| Range | $97,878 | $43,773 |
| Mean | $45,686 | $31,346 |
| Median | $42,626 | $30,830 |
| Interquartile 25% (IQ1) | $35,269 | $26,256 |
| Interquartile 75% (IQ3) | $49,864 | $37,351 |
| Interquartile Range (IQR) | $14,595 | $11,095 |
| Standard Deviation (Sample) | $20,176 | $8,475 |
| Standard Deviation (Population) | $19,977 | $8,446 |
Similar Demographics by Per Capita Income
Demographics Similar to Immigrants from Costa Rica by Per Capita Income
In terms of per capita income, the demographic groups most similar to Immigrants from Costa Rica are Finnish ($43,461, a difference of 0.010%), Tlingit-Haida ($43,516, a difference of 0.12%), Sierra Leonean ($43,405, a difference of 0.14%), Immigrants from South Eastern Asia ($43,539, a difference of 0.17%), and Celtic ($43,621, a difference of 0.36%).
| Demographics | Rating | Rank | Per Capita Income |
| Immigrants | Eastern Africa | 54.9 /100 | #171 | Average $43,838 |
| Czechoslovakians | 54.1 /100 | #172 | Average $43,806 |
| French | 50.7 /100 | #173 | Average $43,685 |
| Colombians | 50.0 /100 | #174 | Average $43,661 |
| Celtics | 48.9 /100 | #175 | Average $43,621 |
| Immigrants | South Eastern Asia | 46.6 /100 | #176 | Average $43,539 |
| Tlingit-Haida | 45.9 /100 | #177 | Average $43,516 |
| Immigrants | Costa Rica | 44.5 /100 | #178 | Average $43,464 |
| Finns | 44.4 /100 | #179 | Average $43,461 |
| Sierra Leoneans | 42.9 /100 | #180 | Average $43,405 |
| Welsh | 38.2 /100 | #181 | Fair $43,233 |
| Immigrants | Vietnam | 38.1 /100 | #182 | Fair $43,229 |
| Germans | 33.9 /100 | #183 | Fair $43,067 |
| Spaniards | 32.9 /100 | #184 | Fair $43,028 |
| Immigrants | Immigrants | 32.5 /100 | #185 | Fair $43,010 |
Demographics Similar to Immigrants from Latin America by Per Capita Income
In terms of per capita income, the demographic groups most similar to Immigrants from Latin America are Immigrants from Haiti ($36,849, a difference of 0.070%), Fijian ($36,690, a difference of 0.36%), Immigrants from Honduras ($36,665, a difference of 0.43%), Ute ($36,651, a difference of 0.47%), and Inupiat ($36,999, a difference of 0.48%).
| Demographics | Rating | Rank | Per Capita Income |
| Immigrants | Bahamas | 0.1 /100 | #300 | Tragic $37,193 |
| Ottawa | 0.1 /100 | #301 | Tragic $37,101 |
| Shoshone | 0.1 /100 | #302 | Tragic $37,072 |
| Paiute | 0.1 /100 | #303 | Tragic $37,066 |
| Hondurans | 0.1 /100 | #304 | Tragic $37,031 |
| Inupiat | 0.1 /100 | #305 | Tragic $36,999 |
| Immigrants | Haiti | 0.0 /100 | #306 | Tragic $36,849 |
| Immigrants | Latin America | 0.0 /100 | #307 | Tragic $36,823 |
| Fijians | 0.0 /100 | #308 | Tragic $36,690 |
| Immigrants | Honduras | 0.0 /100 | #309 | Tragic $36,665 |
| Ute | 0.0 /100 | #310 | Tragic $36,651 |
| Chippewa | 0.0 /100 | #311 | Tragic $36,631 |
| Chickasaw | 0.0 /100 | #312 | Tragic $36,475 |
| Bahamians | 0.0 /100 | #313 | Tragic $36,427 |
| Seminole | 0.0 /100 | #314 | Tragic $36,180 |