German vs Estonian Median Male Earnings
COMPARE
German
Estonian
Median Male Earnings
Median Male Earnings Comparison
Germans
Estonians
$54,974
MEDIAN MALE EARNINGS
61.6/ 100
METRIC RATING
166th/ 347
METRIC RANK
$61,710
MEDIAN MALE EARNINGS
99.9/ 100
METRIC RATING
51st/ 347
METRIC RANK
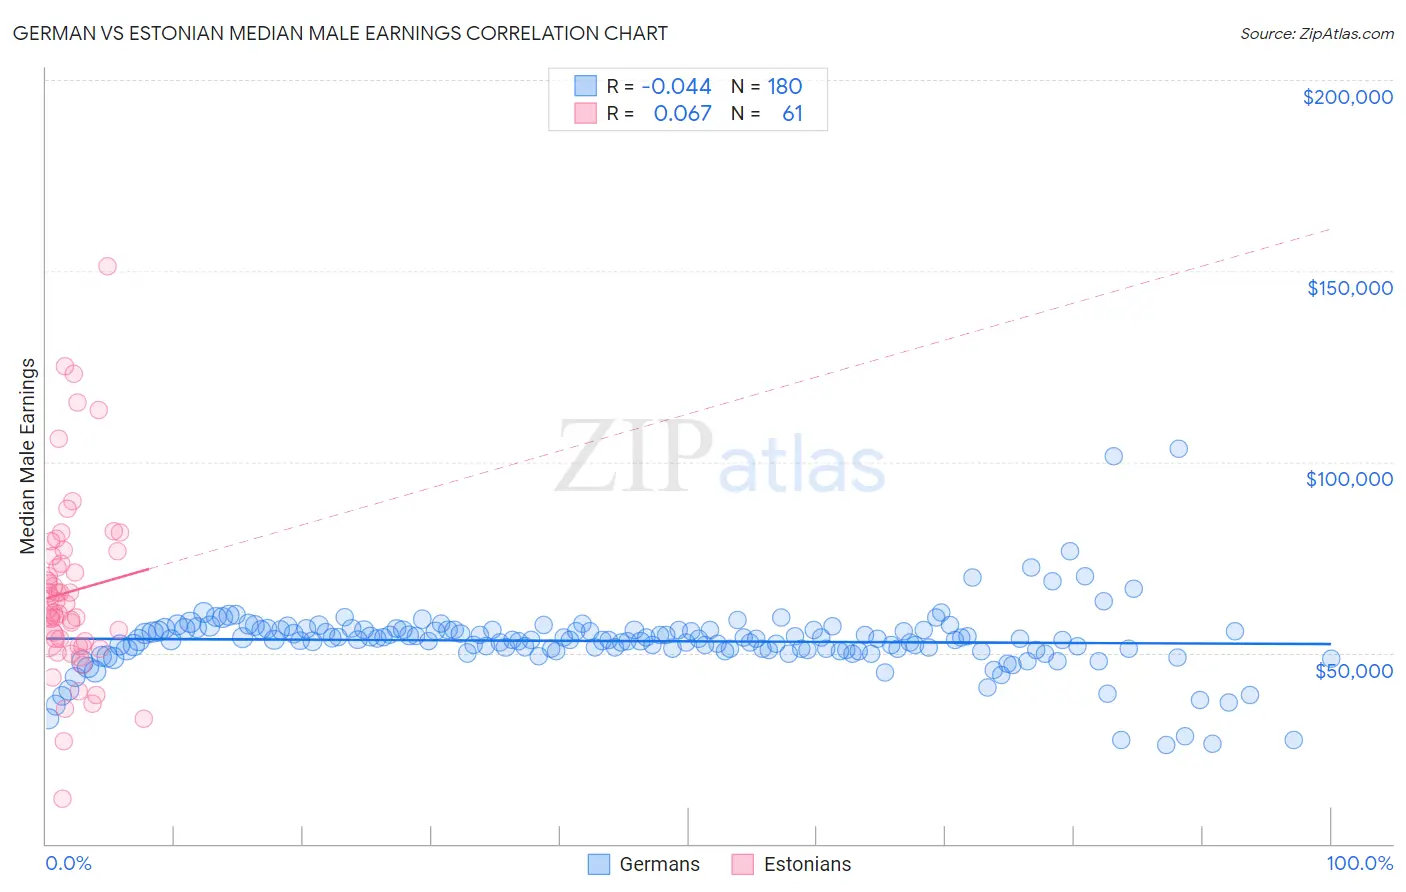
German vs Estonian Median Male Earnings Correlation Chart
The statistical analysis conducted on geographies consisting of 579,097,396 people shows no correlation between the proportion of Germans and median male earnings in the United States with a correlation coefficient (R) of -0.044 and weighted average of $54,974. Similarly, the statistical analysis conducted on geographies consisting of 123,512,238 people shows a slight positive correlation between the proportion of Estonians and median male earnings in the United States with a correlation coefficient (R) of 0.067 and weighted average of $61,710, a difference of 12.2%.
Median Male Earnings Correlation Summary
| Measurement | German | Estonian |
| Minimum | $25,882 | $11,700 |
| Maximum | $103,432 | $151,311 |
| Range | $77,550 | $139,611 |
| Mean | $53,076 | $66,018 |
| Median | $53,458 | $61,673 |
| Interquartile 25% (IQ1) | $50,831 | $52,472 |
| Interquartile 75% (IQ3) | $56,007 | $76,012 |
| Interquartile Range (IQR) | $5,176 | $23,541 |
| Standard Deviation (Sample) | $8,925 | $24,287 |
| Standard Deviation (Population) | $8,900 | $24,087 |
Similar Demographics by Median Male Earnings
Demographics Similar to Germans by Median Male Earnings
In terms of median male earnings, the demographic groups most similar to Germans are Immigrants from Fiji ($54,958, a difference of 0.030%), Immigrants from Vietnam ($54,913, a difference of 0.11%), Immigrants from Portugal ($55,182, a difference of 0.38%), French Canadian ($54,722, a difference of 0.46%), and Finnish ($54,721, a difference of 0.46%).
| Demographics | Rating | Rank | Median Male Earnings |
| Alsatians | 70.5 /100 | #159 | Good $55,380 |
| Basques | 70.3 /100 | #160 | Good $55,370 |
| Belgians | 70.1 /100 | #161 | Good $55,361 |
| French | 69.9 /100 | #162 | Good $55,350 |
| Ugandans | 68.6 /100 | #163 | Good $55,290 |
| Immigrants | South Eastern Asia | 67.6 /100 | #164 | Good $55,241 |
| Immigrants | Portugal | 66.3 /100 | #165 | Good $55,182 |
| Germans | 61.6 /100 | #166 | Good $54,974 |
| Immigrants | Fiji | 61.2 /100 | #167 | Good $54,958 |
| Immigrants | Vietnam | 60.2 /100 | #168 | Good $54,913 |
| French Canadians | 55.6 /100 | #169 | Average $54,722 |
| Finns | 55.6 /100 | #170 | Average $54,721 |
| Immigrants | Peru | 54.9 /100 | #171 | Average $54,695 |
| Welsh | 53.8 /100 | #172 | Average $54,647 |
| South American Indians | 50.4 /100 | #173 | Average $54,508 |
Demographics Similar to Estonians by Median Male Earnings
In terms of median male earnings, the demographic groups most similar to Estonians are Bhutanese ($61,759, a difference of 0.080%), Immigrants from Norway ($61,628, a difference of 0.13%), South African ($61,460, a difference of 0.41%), Immigrants from Latvia ($61,422, a difference of 0.47%), and Immigrants from Europe ($62,057, a difference of 0.56%).
| Demographics | Rating | Rank | Median Male Earnings |
| Cambodians | 100.0 /100 | #44 | Exceptional $62,516 |
| Bulgarians | 100.0 /100 | #45 | Exceptional $62,378 |
| Immigrants | Czechoslovakia | 99.9 /100 | #46 | Exceptional $62,217 |
| Immigrants | Austria | 99.9 /100 | #47 | Exceptional $62,164 |
| Immigrants | Malaysia | 99.9 /100 | #48 | Exceptional $62,121 |
| Immigrants | Europe | 99.9 /100 | #49 | Exceptional $62,057 |
| Bhutanese | 99.9 /100 | #50 | Exceptional $61,759 |
| Estonians | 99.9 /100 | #51 | Exceptional $61,710 |
| Immigrants | Norway | 99.9 /100 | #52 | Exceptional $61,628 |
| South Africans | 99.9 /100 | #53 | Exceptional $61,460 |
| Immigrants | Latvia | 99.9 /100 | #54 | Exceptional $61,422 |
| Greeks | 99.9 /100 | #55 | Exceptional $61,242 |
| Lithuanians | 99.9 /100 | #56 | Exceptional $61,228 |
| Immigrants | Scotland | 99.9 /100 | #57 | Exceptional $61,220 |
| New Zealanders | 99.9 /100 | #58 | Exceptional $61,199 |