Immigrants from Afghanistan vs Estonian Median Male Earnings
COMPARE
Immigrants from Afghanistan
Estonian
Median Male Earnings
Median Male Earnings Comparison
Immigrants from Afghanistan
Estonians
$57,582
MEDIAN MALE EARNINGS
95.4/ 100
METRIC RATING
112th/ 347
METRIC RANK
$61,710
MEDIAN MALE EARNINGS
99.9/ 100
METRIC RATING
51st/ 347
METRIC RANK
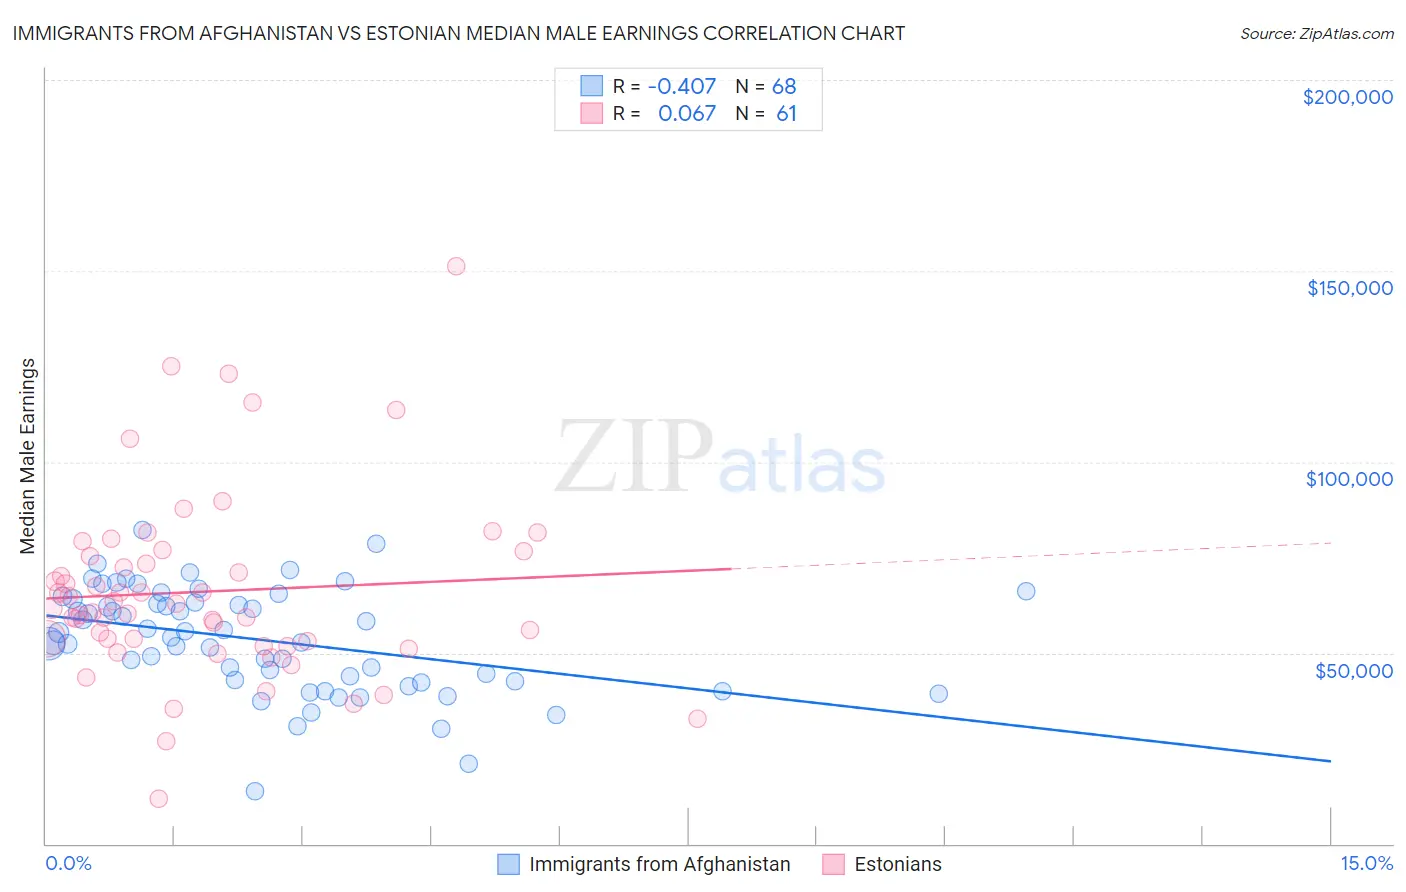
Immigrants from Afghanistan vs Estonian Median Male Earnings Correlation Chart
The statistical analysis conducted on geographies consisting of 147,642,339 people shows a moderate negative correlation between the proportion of Immigrants from Afghanistan and median male earnings in the United States with a correlation coefficient (R) of -0.407 and weighted average of $57,582. Similarly, the statistical analysis conducted on geographies consisting of 123,512,238 people shows a slight positive correlation between the proportion of Estonians and median male earnings in the United States with a correlation coefficient (R) of 0.067 and weighted average of $61,710, a difference of 7.2%.
Median Male Earnings Correlation Summary
| Measurement | Immigrants from Afghanistan | Estonian |
| Minimum | $13,824 | $11,700 |
| Maximum | $82,319 | $151,311 |
| Range | $68,496 | $139,611 |
| Mean | $53,392 | $66,018 |
| Median | $54,756 | $61,673 |
| Interquartile 25% (IQ1) | $42,712 | $52,472 |
| Interquartile 75% (IQ3) | $63,573 | $76,012 |
| Interquartile Range (IQR) | $20,861 | $23,541 |
| Standard Deviation (Sample) | $13,746 | $24,287 |
| Standard Deviation (Population) | $13,644 | $24,087 |
Similar Demographics by Median Male Earnings
Demographics Similar to Immigrants from Afghanistan by Median Male Earnings
In terms of median male earnings, the demographic groups most similar to Immigrants from Afghanistan are Carpatho Rusyn ($57,572, a difference of 0.020%), Immigrants from Kuwait ($57,562, a difference of 0.040%), European ($57,637, a difference of 0.090%), Swedish ($57,445, a difference of 0.24%), and Lebanese ($57,409, a difference of 0.30%).
| Demographics | Rating | Rank | Median Male Earnings |
| Immigrants | Western Asia | 97.3 /100 | #105 | Exceptional $58,131 |
| Immigrants | Northern Africa | 96.9 /100 | #106 | Exceptional $58,008 |
| Serbians | 96.8 /100 | #107 | Exceptional $57,975 |
| Immigrants | Uzbekistan | 96.7 /100 | #108 | Exceptional $57,941 |
| British | 96.5 /100 | #109 | Exceptional $57,890 |
| Palestinians | 96.2 /100 | #110 | Exceptional $57,778 |
| Europeans | 95.6 /100 | #111 | Exceptional $57,637 |
| Immigrants | Afghanistan | 95.4 /100 | #112 | Exceptional $57,582 |
| Carpatho Rusyns | 95.3 /100 | #113 | Exceptional $57,572 |
| Immigrants | Kuwait | 95.3 /100 | #114 | Exceptional $57,562 |
| Swedes | 94.8 /100 | #115 | Exceptional $57,445 |
| Lebanese | 94.6 /100 | #116 | Exceptional $57,409 |
| Immigrants | Zimbabwe | 94.3 /100 | #117 | Exceptional $57,352 |
| Hungarians | 94.0 /100 | #118 | Exceptional $57,309 |
| Arabs | 94.0 /100 | #119 | Exceptional $57,298 |
Demographics Similar to Estonians by Median Male Earnings
In terms of median male earnings, the demographic groups most similar to Estonians are Bhutanese ($61,759, a difference of 0.080%), Immigrants from Norway ($61,628, a difference of 0.13%), South African ($61,460, a difference of 0.41%), Immigrants from Latvia ($61,422, a difference of 0.47%), and Immigrants from Europe ($62,057, a difference of 0.56%).
| Demographics | Rating | Rank | Median Male Earnings |
| Cambodians | 100.0 /100 | #44 | Exceptional $62,516 |
| Bulgarians | 100.0 /100 | #45 | Exceptional $62,378 |
| Immigrants | Czechoslovakia | 99.9 /100 | #46 | Exceptional $62,217 |
| Immigrants | Austria | 99.9 /100 | #47 | Exceptional $62,164 |
| Immigrants | Malaysia | 99.9 /100 | #48 | Exceptional $62,121 |
| Immigrants | Europe | 99.9 /100 | #49 | Exceptional $62,057 |
| Bhutanese | 99.9 /100 | #50 | Exceptional $61,759 |
| Estonians | 99.9 /100 | #51 | Exceptional $61,710 |
| Immigrants | Norway | 99.9 /100 | #52 | Exceptional $61,628 |
| South Africans | 99.9 /100 | #53 | Exceptional $61,460 |
| Immigrants | Latvia | 99.9 /100 | #54 | Exceptional $61,422 |
| Greeks | 99.9 /100 | #55 | Exceptional $61,242 |
| Lithuanians | 99.9 /100 | #56 | Exceptional $61,228 |
| Immigrants | Scotland | 99.9 /100 | #57 | Exceptional $61,220 |
| New Zealanders | 99.9 /100 | #58 | Exceptional $61,199 |