Immigrants from Colombia vs Ghanaian Median Male Earnings
COMPARE
Immigrants from Colombia
Ghanaian
Median Male Earnings
Median Male Earnings Comparison
Immigrants from Colombia
Ghanaians
$52,725
MEDIAN MALE EARNINGS
15.0/ 100
METRIC RATING
205th/ 347
METRIC RANK
$52,810
MEDIAN MALE EARNINGS
16.1/ 100
METRIC RATING
204th/ 347
METRIC RANK
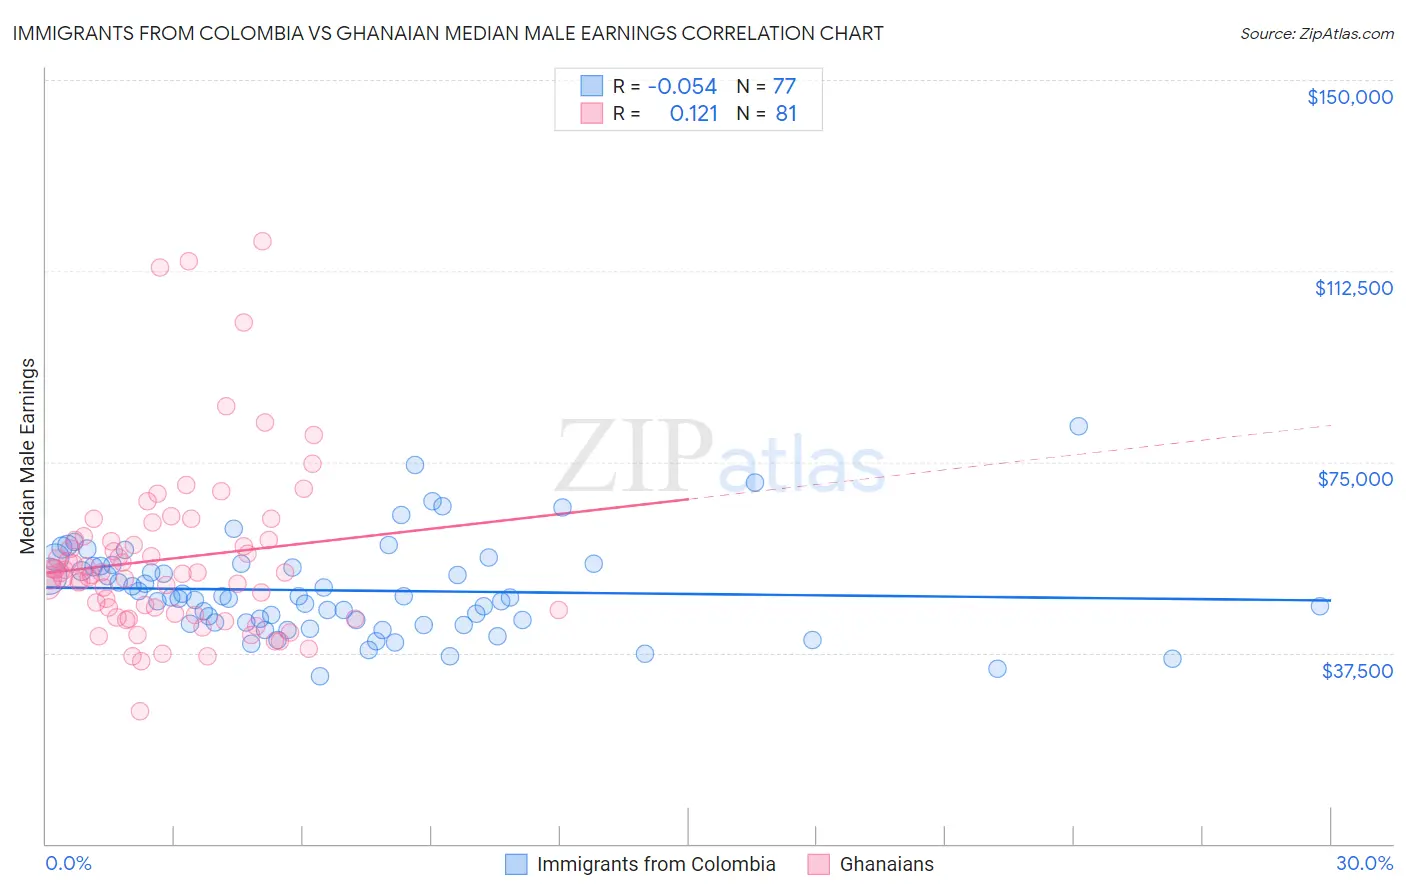
Immigrants from Colombia vs Ghanaian Median Male Earnings Correlation Chart
The statistical analysis conducted on geographies consisting of 378,593,479 people shows a slight negative correlation between the proportion of Immigrants from Colombia and median male earnings in the United States with a correlation coefficient (R) of -0.054 and weighted average of $52,725. Similarly, the statistical analysis conducted on geographies consisting of 190,703,925 people shows a poor positive correlation between the proportion of Ghanaians and median male earnings in the United States with a correlation coefficient (R) of 0.121 and weighted average of $52,810, a difference of 0.16%.
Median Male Earnings Correlation Summary
| Measurement | Immigrants from Colombia | Ghanaian |
| Minimum | $32,886 | $26,089 |
| Maximum | $81,875 | $118,333 |
| Range | $48,989 | $92,244 |
| Mean | $49,733 | $55,935 |
| Median | $48,323 | $53,206 |
| Interquartile 25% (IQ1) | $43,300 | $44,949 |
| Interquartile 75% (IQ3) | $54,661 | $59,627 |
| Interquartile Range (IQR) | $11,361 | $14,678 |
| Standard Deviation (Sample) | $9,264 | $16,875 |
| Standard Deviation (Population) | $9,204 | $16,771 |
Demographics Similar to Immigrants from Colombia and Ghanaians by Median Male Earnings
In terms of median male earnings, the demographic groups most similar to Immigrants from Colombia are Immigrants from Iraq ($52,681, a difference of 0.080%), Panamanian ($52,835, a difference of 0.21%), Immigrants from Uruguay ($52,860, a difference of 0.26%), Immigrants from Bosnia and Herzegovina ($52,869, a difference of 0.27%), and Immigrants from Thailand ($52,908, a difference of 0.35%). Similarly, the demographic groups most similar to Ghanaians are Panamanian ($52,835, a difference of 0.050%), Immigrants from Uruguay ($52,860, a difference of 0.10%), Immigrants from Bosnia and Herzegovina ($52,869, a difference of 0.11%), Immigrants from Thailand ($52,908, a difference of 0.19%), and Immigrants from Iraq ($52,681, a difference of 0.24%).
| Demographics | Rating | Rank | Median Male Earnings |
| Spanish | 29.0 /100 | #194 | Fair $53,576 |
| Immigrants | Azores | 27.5 /100 | #195 | Fair $53,503 |
| Immigrants | Africa | 26.6 /100 | #196 | Fair $53,457 |
| Immigrants | Kenya | 26.0 /100 | #197 | Fair $53,427 |
| Immigrants | Costa Rica | 22.6 /100 | #198 | Fair $53,237 |
| Tongans | 22.3 /100 | #199 | Fair $53,218 |
| Immigrants | Thailand | 17.5 /100 | #200 | Poor $52,908 |
| Immigrants | Bosnia and Herzegovina | 16.9 /100 | #201 | Poor $52,869 |
| Immigrants | Uruguay | 16.8 /100 | #202 | Poor $52,860 |
| Panamanians | 16.5 /100 | #203 | Poor $52,835 |
| Ghanaians | 16.1 /100 | #204 | Poor $52,810 |
| Immigrants | Colombia | 15.0 /100 | #205 | Poor $52,725 |
| Immigrants | Iraq | 14.5 /100 | #206 | Poor $52,681 |
| Vietnamese | 12.7 /100 | #207 | Poor $52,525 |
| Venezuelans | 12.5 /100 | #208 | Poor $52,510 |
| Bermudans | 12.1 /100 | #209 | Poor $52,465 |
| Delaware | 11.5 /100 | #210 | Poor $52,412 |
| Tlingit-Haida | 11.5 /100 | #211 | Poor $52,409 |
| Cajuns | 10.7 /100 | #212 | Poor $52,325 |
| Native Hawaiians | 10.5 /100 | #213 | Poor $52,306 |
| Immigrants | Nonimmigrants | 9.3 /100 | #214 | Tragic $52,170 |