Immigrants from Colombia vs Colombian 5th Grade

COMPARE

Immigrants from Colombia
Race
Ancestry
AfghanAfricanAlaska NativeAlaskan AthabascanAlbanianAleutAlsatianAmericanApacheArabArapahoArgentineanArmenianAssyrian/Chaldean/SyriacAustralianAustrianBahamianBangladeshiBarbadianBasqueBelgianBelizeanBermudanBhutaneseBlackfeetBolivianBrazilianBritishBritish West IndianBulgarianBurmeseCajunCambodianCanadianCape VerdeanCarpatho RusynCelticCentral AmericanCentral American IndianCherokeeCheyenneChickasawChileanChineseChippewaChoctawColvilleComancheCosta RicanCreeCreekCroatianCrowCubanCypriotCzechCzechoslovakianDanishDelawareDominicanDutchDutch West IndianEastern EuropeanEcuadorianEgyptianEnglishEstonianEthiopianEuropeanFijianFilipinoFinnishFrenchFrench American IndianFrench CanadianGermanGerman RussianGhanaianGreekGuamanian/ChamorroGuatemalanGuyaneseHaitianHmongHonduranHopiHoumaHungarianIcelanderIndian (Asian)IndonesianInupiatIranianIraqiIrishIroquoisIsraeliItalianJamaicanJapaneseJordanianKenyanKiowaKoreanLaotianLatvianLebaneseLiberianLithuanianLumbeeLuxembourgerMacedonianMalaysianMalteseMarshalleseMenomineeMexicanMexican American IndianMongolianMoroccanNative HawaiianNavajoNepaleseNew ZealanderNicaraguanNigerianNorthern EuropeanNorwegianOkinawanOsageOttawaPaiutePakistaniPalestinianPanamanianParaguayanPennsylvania GermanPeruvianPimaPolishPortuguesePotawatomiPuebloPuerto RicanPuget Sound SalishRomanianRussianSalvadoranSamoanScandinavianScotch-IrishScottishSeminoleSenegaleseSerbianShoshoneSierra LeoneanSiouxSlavicSlovakSloveneSomaliSouth AfricanSouth AmericanSouth American IndianSoviet UnionSpaniardSpanishSpanish AmericanSpanish American IndianSri LankanSubsaharan AfricanSudaneseSwedishSwissSyrianTaiwaneseThaiTlingit-HaidaTohono O'OdhamTonganTrinidadian and TobagonianTsimshianTurkishU.S. Virgin IslanderUgandanUkrainianUruguayanUteVenezuelanVietnameseWelshWest IndianYakamaYaquiYugoslavianYumanYup'ikZimbabwean
Immigration
NonimmigrantsImmigrantsAfghanistanAfricaAlbaniaArgentinaArmeniaAsiaAustraliaAustriaBahamasBangladeshBarbadosBelarusBelgiumBelizeBoliviaBosnia and HerzegovinaBrazilBulgariaBurma/MyanmarCabo VerdeCambodiaCameroonCanadaCaribbeanCentral AmericaChileChinaColombiaCongoCosta RicaCroatiaCubaCzechoslovakiaDenmarkDominicaDominican RepublicEastern AfricaEastern AsiaEastern EuropeEcuadorEgyptEl SalvadorEnglandEritreaEthiopiaEuropeFijiFranceGermanyGhanaGreeceGrenadaGuatemalaGuyanaHaitiHondurasHong KongHungaryIndiaIndonesiaIranIraqIrelandIsraelItalyJamaicaJapanJordanKazakhstanKenyaKoreaKuwaitLaosLatin AmericaLatviaLebanonLiberiaLithuaniaMalaysiaMexicoMicronesiaMiddle AfricaMoldovaMoroccoNepalNetherlandsNicaraguaNigeriaNorth AmericaNorth MacedoniaNorthern AfricaNorthern EuropeNorwayOceaniaPakistanPanamaPeruPhilippinesPolandPortugalRomaniaRussiaSaudi ArabiaScotlandSenegalSerbiaSierra LeoneSingaporeSomaliaSouth AfricaSouth AmericaSouth Central AsiaSouth Eastern AsiaSouthern EuropeSpainSri LankaSt. Vincent and the GrenadinesSudanSwedenSwitzerlandSyriaTaiwanThailandTrinidad and TobagoTurkeyUgandaUkraineUruguayUzbekistanVenezuelaVietnamWest IndiesWestern AfricaWestern AsiaWestern EuropeYemenZaireZimbabweAzores
Colombian
Race
Ancestry
AfghanAfricanAlaska NativeAlaskan AthabascanAlbanianAleutAlsatianAmericanApacheArabArapahoArgentineanArmenianAssyrian/Chaldean/SyriacAustralianAustrianBahamianBangladeshiBarbadianBasqueBelgianBelizeanBermudanBhutaneseBlackfeetBolivianBrazilianBritishBritish West IndianBulgarianBurmeseCajunCambodianCanadianCape VerdeanCarpatho RusynCelticCentral AmericanCentral American IndianCherokeeCheyenneChickasawChileanChineseChippewaChoctawColombianColvilleComancheCosta RicanCreeCreekCroatianCrowCubanCypriotCzechCzechoslovakianDanishDelawareDominicanDutchDutch West IndianEastern EuropeanEcuadorianEgyptianEnglishEstonianEthiopianEuropeanFijianFilipinoFinnishFrenchFrench American IndianFrench CanadianGermanGerman RussianGhanaianGreekGuamanian/ChamorroGuatemalanGuyaneseHaitianHmongHonduranHopiHoumaHungarianIcelanderIndian (Asian)IndonesianInupiatIranianIraqiIrishIroquoisIsraeliItalianJamaicanJapaneseJordanianKenyanKiowaKoreanLaotianLatvianLebaneseLiberianLithuanianLumbeeLuxembourgerMacedonianMalaysianMalteseMarshalleseMenomineeMexicanMexican American IndianMongolianMoroccanNative HawaiianNavajoNepaleseNew ZealanderNicaraguanNigerianNorthern EuropeanNorwegianOkinawanOsageOttawaPaiutePakistaniPalestinianPanamanianParaguayanPennsylvania GermanPeruvianPimaPolishPortuguesePotawatomiPuebloPuerto RicanPuget Sound SalishRomanianRussianSalvadoranSamoanScandinavianScotch-IrishScottishSeminoleSenegaleseSerbianShoshoneSierra LeoneanSiouxSlavicSlovakSloveneSomaliSouth AfricanSouth AmericanSouth American IndianSoviet UnionSpaniardSpanishSpanish AmericanSpanish American IndianSri LankanSubsaharan AfricanSudaneseSwedishSwissSyrianTaiwaneseThaiTlingit-HaidaTohono O'OdhamTonganTrinidadian and TobagonianTsimshianTurkishU.S. Virgin IslanderUgandanUkrainianUruguayanUteVenezuelanVietnameseWelshWest IndianYakamaYaquiYugoslavianYumanYup'ikZimbabwean
Immigration
NonimmigrantsImmigrantsAfghanistanAfricaAlbaniaArgentinaArmeniaAsiaAustraliaAustriaBahamasBangladeshBarbadosBelarusBelgiumBelizeBoliviaBosnia and HerzegovinaBrazilBulgariaBurma/MyanmarCabo VerdeCambodiaCameroonCanadaCaribbeanCentral AmericaChileChinaCongoCosta RicaCroatiaCubaCzechoslovakiaDenmarkDominicaDominican RepublicEastern AfricaEastern AsiaEastern EuropeEcuadorEgyptEl SalvadorEnglandEritreaEthiopiaEuropeFijiFranceGermanyGhanaGreeceGrenadaGuatemalaGuyanaHaitiHondurasHong KongHungaryIndiaIndonesiaIranIraqIrelandIsraelItalyJamaicaJapanJordanKazakhstanKenyaKoreaKuwaitLaosLatin AmericaLatviaLebanonLiberiaLithuaniaMalaysiaMexicoMicronesiaMiddle AfricaMoldovaMoroccoNepalNetherlandsNicaraguaNigeriaNorth AmericaNorth MacedoniaNorthern AfricaNorthern EuropeNorwayOceaniaPakistanPanamaPeruPhilippinesPolandPortugalRomaniaRussiaSaudi ArabiaScotlandSenegalSerbiaSierra LeoneSingaporeSomaliaSouth AfricaSouth AmericaSouth Central AsiaSouth Eastern AsiaSouthern EuropeSpainSri LankaSt. Vincent and the GrenadinesSudanSwedenSwitzerlandSyriaTaiwanThailandTrinidad and TobagoTurkeyUgandaUkraineUruguayUzbekistanVenezuelaVietnamWest IndiesWestern AfricaWestern AsiaWestern EuropeYemenZaireZimbabweAzores
5th Grade
Income
Poverty
Unemployment
Labor Participation
Family Structure
Vehicle Availability
Education Level
Disability

5th Grade Comparison

Immigrants from Colombia

Colombians

Tragic
Tragic
96.8%
5TH GRADE
0.4/ 100
METRIC RATING
262nd/ 347
METRIC RANK
96.9%
5TH GRADE
1.3/ 100
METRIC RATING
245th/ 347
METRIC RANK

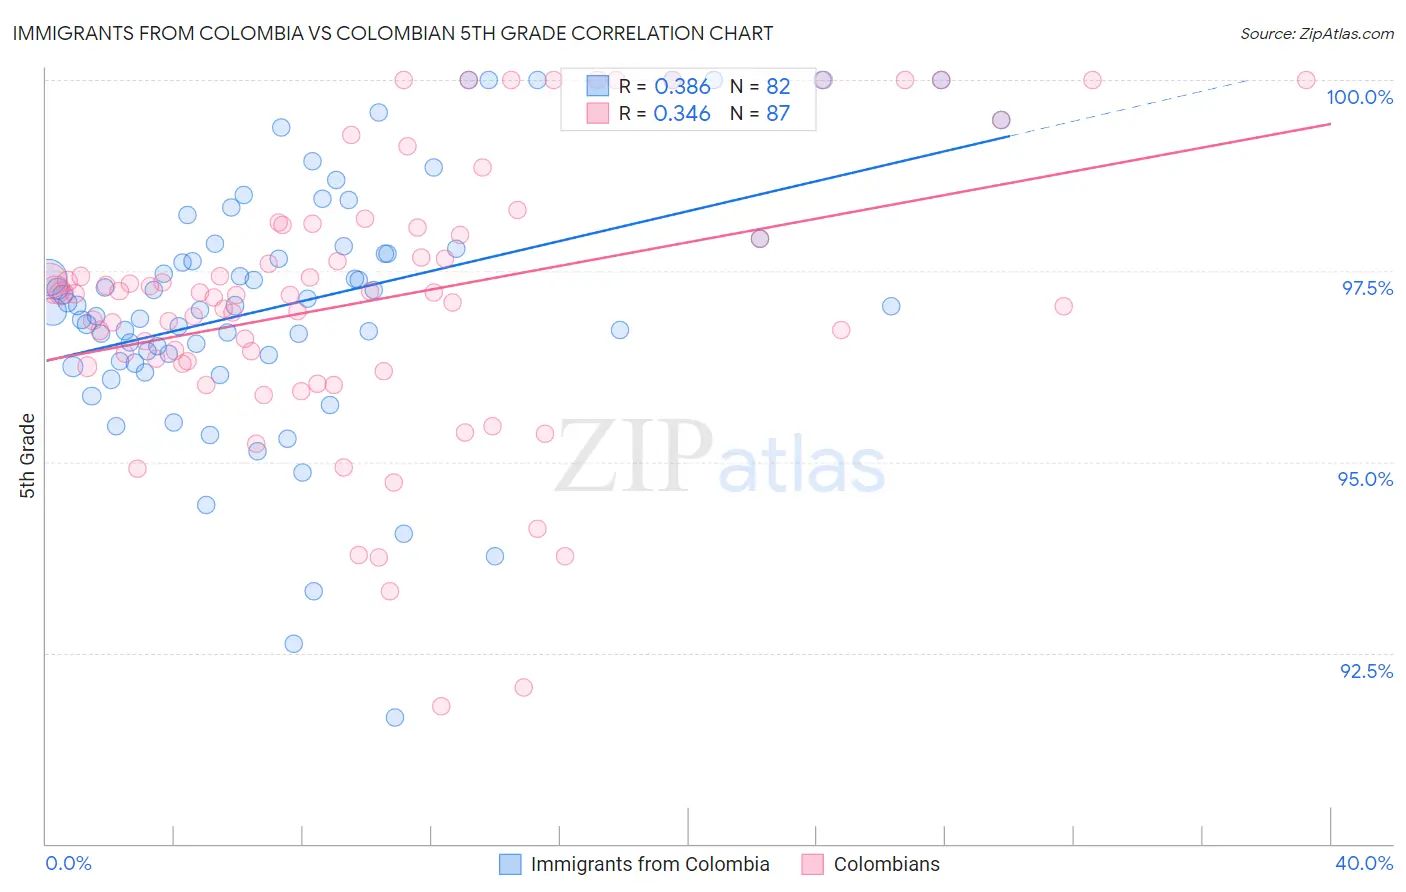
Immigrants from Colombia vs Colombian 5th Grade Correlation Chart

The statistical analysis conducted on geographies consisting of 378,643,693 people shows a mild positive correlation between the proportion of Immigrants from Colombia and percentage of population with at least 5th grade education in the United States with a correlation coefficient (R) of 0.386 and weighted average of 96.8%. Similarly, the statistical analysis conducted on geographies consisting of 419,701,178 people shows a mild positive correlation between the proportion of Colombians and percentage of population with at least 5th grade education in the United States with a correlation coefficient (R) of 0.346 and weighted average of 96.9%, a difference of 0.13%.
Immigrants from Colombia vs Colombian 5th Grade

5th Grade Correlation Summary

MeasurementImmigrants from ColombiaColombian
Minimum91.6%91.8%
Maximum100.0%100.0%
Range8.4%8.2%
Mean97.1%97.1%
Median97.0%97.2%
Interquartile 25% (IQ1)96.4%96.3%
Interquartile 75% (IQ3)97.8%98.1%
Interquartile Range (IQR)1.4%1.8%
Standard Deviation (Sample)1.7%1.8%
Standard Deviation (Population)1.6%1.8%

Demographics Similar to Immigrants from Colombia and Colombians by 5th Grade

In terms of 5th grade, the demographic groups most similar to Immigrants from Colombia are Immigrants from Jamaica (96.8%, a difference of 0.0%), Immigrants from Sierra Leone (96.8%, a difference of 0.0%), Immigrants from Uzbekistan (96.8%, a difference of 0.010%), Immigrants from China (96.8%, a difference of 0.020%), and Immigrants from Ethiopia (96.8%, a difference of 0.030%). Similarly, the demographic groups most similar to Colombians are Ethiopian (96.9%, a difference of 0.010%), Immigrants from Eastern Africa (96.9%, a difference of 0.020%), Korean (96.9%, a difference of 0.020%), Immigrants from Africa (96.9%, a difference of 0.020%), and U.S. Virgin Islander (96.9%, a difference of 0.020%).
DemographicsRating | Rank5th Grade
Immigrants | Eastern Africa
1.6
/100
|
#243
Tragic
96.9%
Koreans
1.6
/100
|
#244
Tragic
96.9%
Colombians
1.3
/100
|
#245
Tragic
96.9%
Ethiopians
1.2
/100
|
#246
Tragic
96.9%
Immigrants | Africa
1.1
/100
|
#247
Tragic
96.9%
U.S. Virgin Islanders
1.1
/100
|
#248
Tragic
96.9%
Immigrants | Uruguay
1.0
/100
|
#249
Tragic
96.9%
Immigrants | Liberia
1.0
/100
|
#250
Tragic
96.9%
Bolivians
0.9
/100
|
#251
Tragic
96.9%
Jamaicans
0.9
/100
|
#252
Tragic
96.9%
Immigrants | Middle Africa
0.8
/100
|
#253
Tragic
96.8%
Immigrants | Senegal
0.8
/100
|
#254
Tragic
96.8%
South Americans
0.7
/100
|
#255
Tragic
96.8%
Immigrants | Congo
0.7
/100
|
#256
Tragic
96.8%
Peruvians
0.6
/100
|
#257
Tragic
96.8%
Immigrants | Ethiopia
0.5
/100
|
#258
Tragic
96.8%
Immigrants | China
0.5
/100
|
#259
Tragic
96.8%
Immigrants | Jamaica
0.4
/100
|
#260
Tragic
96.8%
Immigrants | Sierra Leone
0.4
/100
|
#261
Tragic
96.8%
Immigrants | Colombia
0.4
/100
|
#262
Tragic
96.8%
Immigrants | Uzbekistan
0.3
/100
|
#263
Tragic
96.8%