Bolivian vs Maltese Median Household Income
COMPARE
Bolivian
Maltese
Median Household Income
Median Household Income Comparison
Bolivians
Maltese
$102,195
MEDIAN HOUSEHOLD INCOME
100.0/ 100
METRIC RATING
20th/ 347
METRIC RANK
$97,015
MEDIAN HOUSEHOLD INCOME
100.0/ 100
METRIC RATING
40th/ 347
METRIC RANK
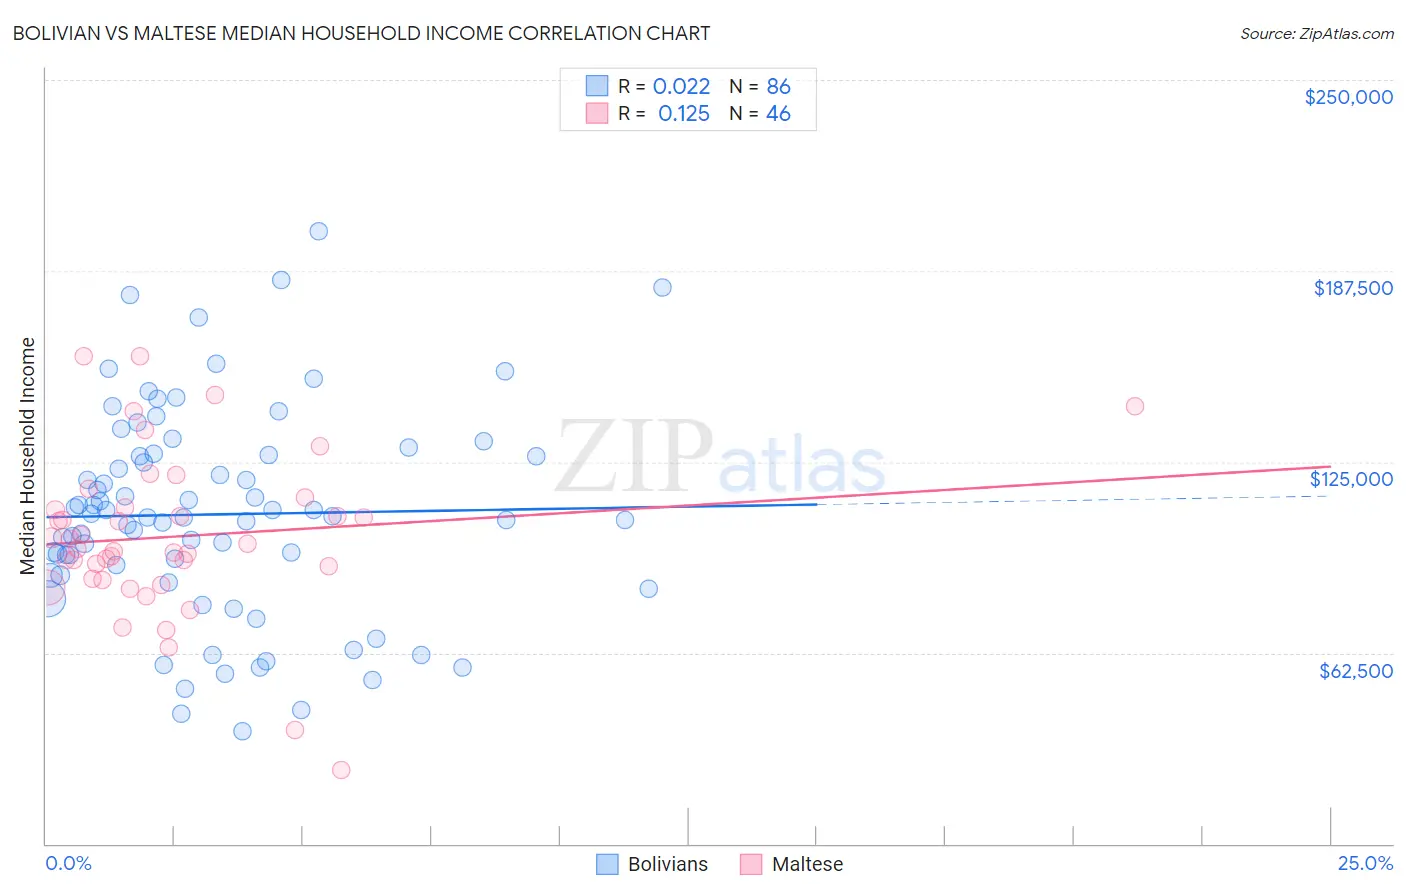
Bolivian vs Maltese Median Household Income Correlation Chart
The statistical analysis conducted on geographies consisting of 184,606,856 people shows no correlation between the proportion of Bolivians and median household income in the United States with a correlation coefficient (R) of 0.022 and weighted average of $102,195. Similarly, the statistical analysis conducted on geographies consisting of 126,420,319 people shows a poor positive correlation between the proportion of Maltese and median household income in the United States with a correlation coefficient (R) of 0.125 and weighted average of $97,015, a difference of 5.3%.
Median Household Income Correlation Summary
| Measurement | Bolivian | Maltese |
| Minimum | $36,777 | $24,250 |
| Maximum | $200,625 | $159,651 |
| Range | $163,848 | $135,401 |
| Mean | $107,810 | $100,571 |
| Median | $106,861 | $97,403 |
| Interquartile 25% (IQ1) | $87,882 | $86,626 |
| Interquartile 75% (IQ3) | $127,141 | $110,225 |
| Interquartile Range (IQR) | $39,259 | $23,599 |
| Standard Deviation (Sample) | $34,248 | $26,669 |
| Standard Deviation (Population) | $34,049 | $26,378 |
Demographics Similar to Bolivians and Maltese by Median Household Income
In terms of median household income, the demographic groups most similar to Bolivians are Eastern European ($101,781, a difference of 0.41%), Asian ($101,681, a difference of 0.50%), Immigrants from Bolivia ($101,394, a difference of 0.79%), Immigrants from Japan ($100,711, a difference of 1.5%), and Immigrants from Sweden ($100,699, a difference of 1.5%). Similarly, the demographic groups most similar to Maltese are Afghan ($97,026, a difference of 0.010%), Immigrants from Indonesia ($97,297, a difference of 0.29%), Latvian ($97,311, a difference of 0.31%), Immigrants from Pakistan ($97,528, a difference of 0.53%), and Immigrants from Switzerland ($97,979, a difference of 0.99%).
| Demographics | Rating | Rank | Median Household Income |
| Bolivians | 100.0 /100 | #20 | Exceptional $102,195 |
| Eastern Europeans | 100.0 /100 | #21 | Exceptional $101,781 |
| Asians | 100.0 /100 | #22 | Exceptional $101,681 |
| Immigrants | Bolivia | 100.0 /100 | #23 | Exceptional $101,394 |
| Immigrants | Japan | 100.0 /100 | #24 | Exceptional $100,711 |
| Immigrants | Sweden | 100.0 /100 | #25 | Exceptional $100,699 |
| Immigrants | Belgium | 100.0 /100 | #26 | Exceptional $100,306 |
| Bhutanese | 100.0 /100 | #27 | Exceptional $100,151 |
| Immigrants | Sri Lanka | 100.0 /100 | #28 | Exceptional $99,943 |
| Immigrants | Asia | 100.0 /100 | #29 | Exceptional $99,933 |
| Immigrants | Northern Europe | 100.0 /100 | #30 | Exceptional $99,813 |
| Turks | 100.0 /100 | #31 | Exceptional $99,389 |
| Immigrants | Denmark | 100.0 /100 | #32 | Exceptional $98,510 |
| Chinese | 100.0 /100 | #33 | Exceptional $98,496 |
| Russians | 100.0 /100 | #34 | Exceptional $98,008 |
| Immigrants | Switzerland | 100.0 /100 | #35 | Exceptional $97,979 |
| Immigrants | Pakistan | 100.0 /100 | #36 | Exceptional $97,528 |
| Latvians | 100.0 /100 | #37 | Exceptional $97,311 |
| Immigrants | Indonesia | 100.0 /100 | #38 | Exceptional $97,297 |
| Afghans | 100.0 /100 | #39 | Exceptional $97,026 |
| Maltese | 100.0 /100 | #40 | Exceptional $97,015 |