Native Hawaiian vs Maltese Median Household Income
COMPARE
Native Hawaiian
Maltese
Median Household Income
Median Household Income Comparison
Native Hawaiians
Maltese
$89,919
MEDIAN HOUSEHOLD INCOME
95.7/ 100
METRIC RATING
116th/ 347
METRIC RANK
$97,015
MEDIAN HOUSEHOLD INCOME
100.0/ 100
METRIC RATING
40th/ 347
METRIC RANK
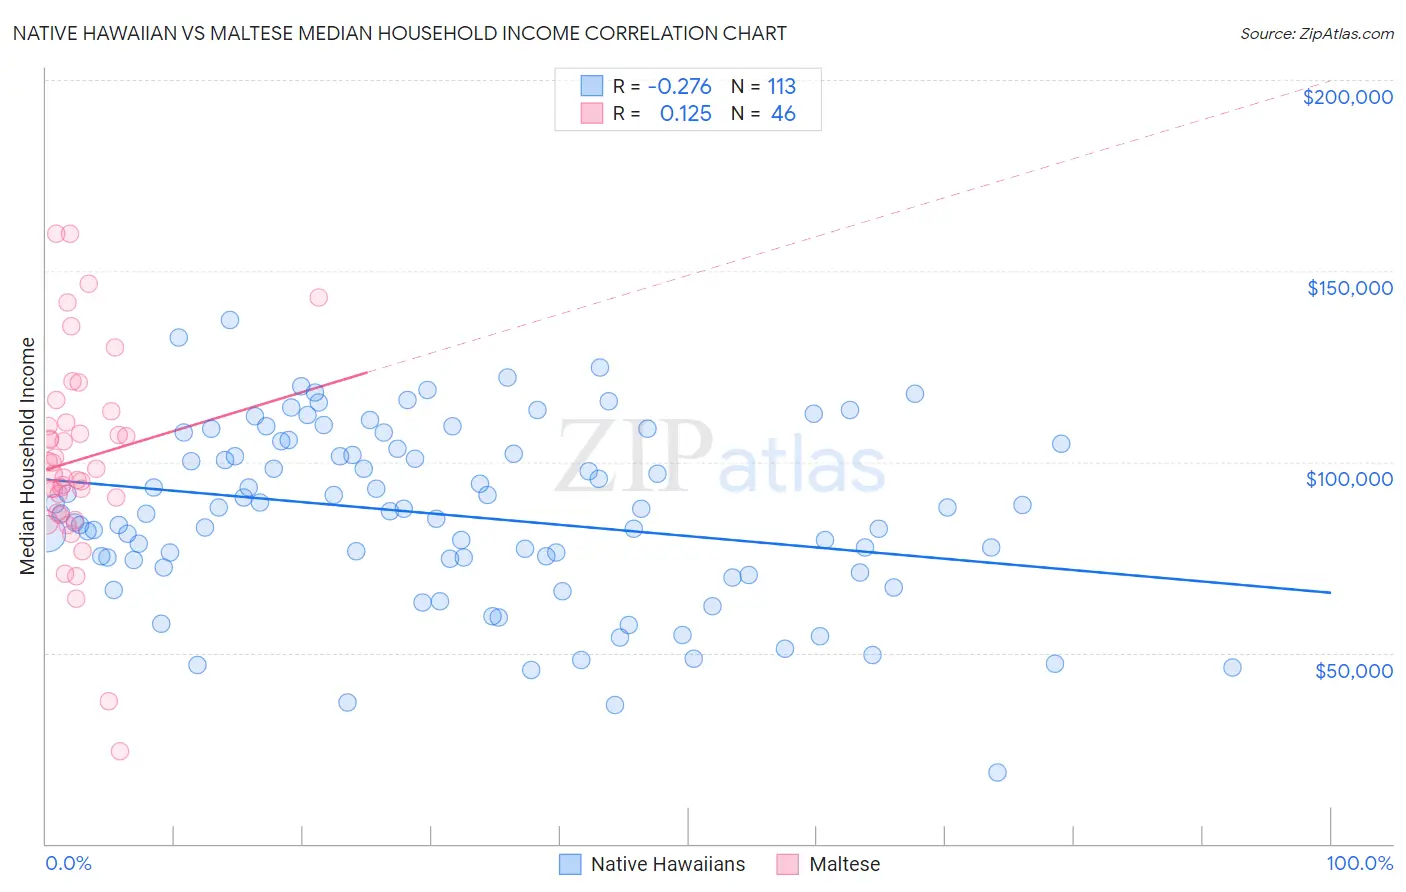
Native Hawaiian vs Maltese Median Household Income Correlation Chart
The statistical analysis conducted on geographies consisting of 331,802,706 people shows a weak negative correlation between the proportion of Native Hawaiians and median household income in the United States with a correlation coefficient (R) of -0.276 and weighted average of $89,919. Similarly, the statistical analysis conducted on geographies consisting of 126,420,319 people shows a poor positive correlation between the proportion of Maltese and median household income in the United States with a correlation coefficient (R) of 0.125 and weighted average of $97,015, a difference of 7.9%.
Median Household Income Correlation Summary
| Measurement | Native Hawaiian | Maltese |
| Minimum | $18,739 | $24,250 |
| Maximum | $137,302 | $159,651 |
| Range | $118,563 | $135,401 |
| Mean | $86,036 | $100,571 |
| Median | $87,089 | $97,403 |
| Interquartile 25% (IQ1) | $73,233 | $86,626 |
| Interquartile 75% (IQ3) | $104,035 | $110,225 |
| Interquartile Range (IQR) | $30,802 | $23,599 |
| Standard Deviation (Sample) | $23,037 | $26,669 |
| Standard Deviation (Population) | $22,935 | $26,378 |
Similar Demographics by Median Household Income
Demographics Similar to Native Hawaiians by Median Household Income
In terms of median household income, the demographic groups most similar to Native Hawaiians are Taiwanese ($89,900, a difference of 0.020%), Immigrants from Western Asia ($90,005, a difference of 0.10%), Syrian ($89,830, a difference of 0.10%), Immigrants from Northern Africa ($90,026, a difference of 0.12%), and Albanian ($89,744, a difference of 0.20%).
| Demographics | Rating | Rank | Median Household Income |
| Chileans | 97.2 /100 | #109 | Exceptional $90,605 |
| Palestinians | 97.1 /100 | #110 | Exceptional $90,574 |
| Immigrants | Poland | 97.1 /100 | #111 | Exceptional $90,549 |
| Northern Europeans | 96.9 /100 | #112 | Exceptional $90,446 |
| Peruvians | 96.5 /100 | #113 | Exceptional $90,261 |
| Immigrants | Northern Africa | 95.9 /100 | #114 | Exceptional $90,026 |
| Immigrants | Western Asia | 95.9 /100 | #115 | Exceptional $90,005 |
| Native Hawaiians | 95.7 /100 | #116 | Exceptional $89,919 |
| Taiwanese | 95.6 /100 | #117 | Exceptional $89,900 |
| Syrians | 95.4 /100 | #118 | Exceptional $89,830 |
| Albanians | 95.2 /100 | #119 | Exceptional $89,744 |
| Immigrants | North Macedonia | 95.2 /100 | #120 | Exceptional $89,741 |
| Ethiopians | 94.9 /100 | #121 | Exceptional $89,640 |
| Pakistanis | 94.8 /100 | #122 | Exceptional $89,638 |
| Immigrants | Zimbabwe | 94.4 /100 | #123 | Exceptional $89,496 |
Demographics Similar to Maltese by Median Household Income
In terms of median household income, the demographic groups most similar to Maltese are Afghan ($97,026, a difference of 0.010%), Immigrants from Turkey ($96,964, a difference of 0.050%), Immigrants from Lithuania ($96,836, a difference of 0.18%), Immigrants from France ($96,743, a difference of 0.28%), and Immigrants from Indonesia ($97,297, a difference of 0.29%).
| Demographics | Rating | Rank | Median Household Income |
| Chinese | 100.0 /100 | #33 | Exceptional $98,496 |
| Russians | 100.0 /100 | #34 | Exceptional $98,008 |
| Immigrants | Switzerland | 100.0 /100 | #35 | Exceptional $97,979 |
| Immigrants | Pakistan | 100.0 /100 | #36 | Exceptional $97,528 |
| Latvians | 100.0 /100 | #37 | Exceptional $97,311 |
| Immigrants | Indonesia | 100.0 /100 | #38 | Exceptional $97,297 |
| Afghans | 100.0 /100 | #39 | Exceptional $97,026 |
| Maltese | 100.0 /100 | #40 | Exceptional $97,015 |
| Immigrants | Turkey | 100.0 /100 | #41 | Exceptional $96,964 |
| Immigrants | Lithuania | 99.9 /100 | #42 | Exceptional $96,836 |
| Immigrants | France | 99.9 /100 | #43 | Exceptional $96,743 |
| Immigrants | Greece | 99.9 /100 | #44 | Exceptional $96,675 |
| Israelis | 99.9 /100 | #45 | Exceptional $96,552 |
| Australians | 99.9 /100 | #46 | Exceptional $96,490 |
| Immigrants | Russia | 99.9 /100 | #47 | Exceptional $96,378 |