Immigrants from Australia vs Maltese Median Household Income
COMPARE
Immigrants from Australia
Maltese
Median Household Income
Median Household Income Comparison
Immigrants from Australia
Maltese
$102,562
MEDIAN HOUSEHOLD INCOME
100.0/ 100
METRIC RATING
19th/ 347
METRIC RANK
$97,015
MEDIAN HOUSEHOLD INCOME
100.0/ 100
METRIC RATING
40th/ 347
METRIC RANK
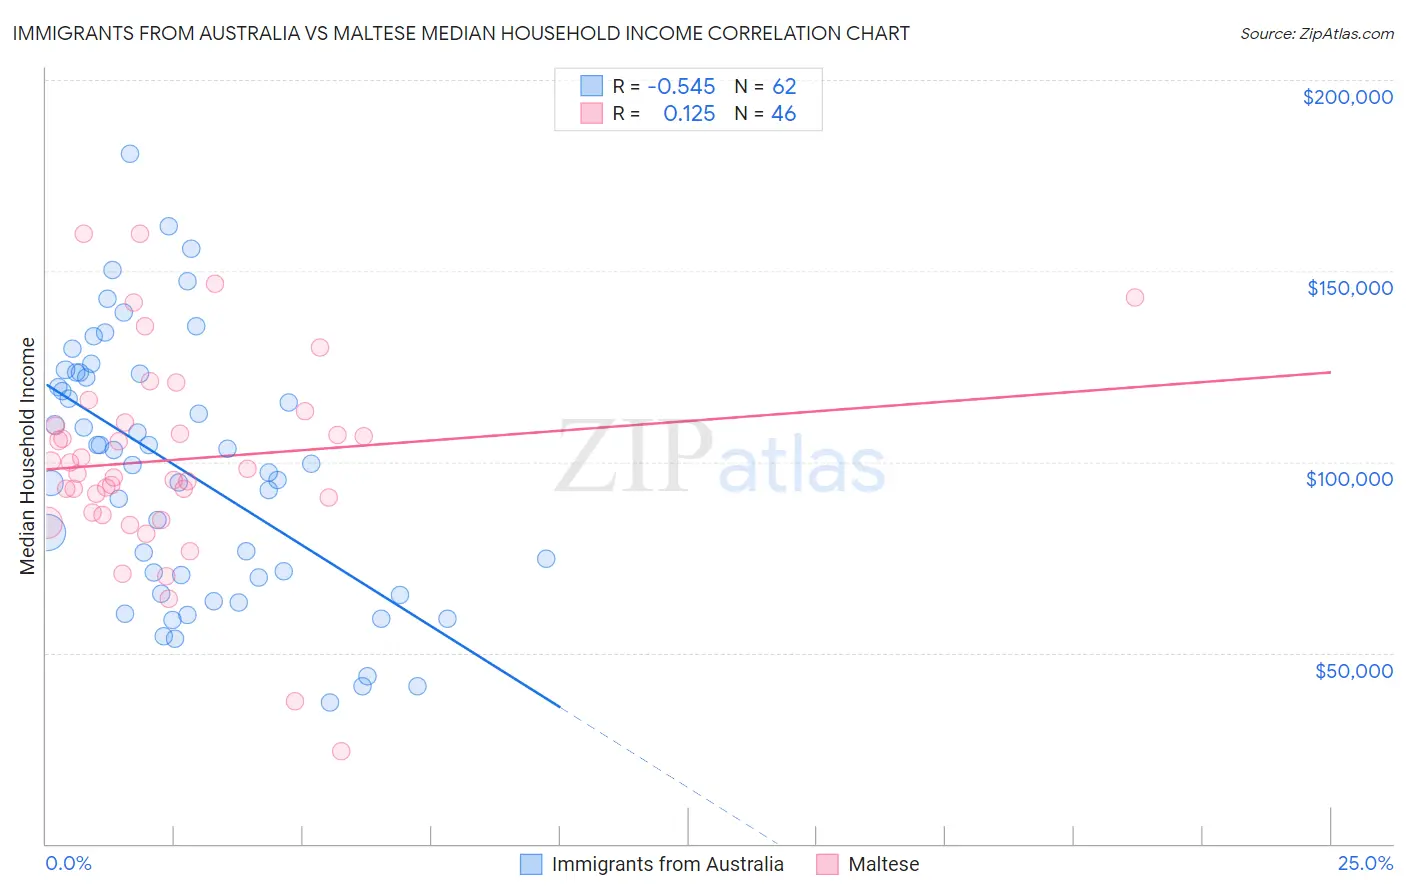
Immigrants from Australia vs Maltese Median Household Income Correlation Chart
The statistical analysis conducted on geographies consisting of 227,116,578 people shows a substantial negative correlation between the proportion of Immigrants from Australia and median household income in the United States with a correlation coefficient (R) of -0.545 and weighted average of $102,562. Similarly, the statistical analysis conducted on geographies consisting of 126,420,319 people shows a poor positive correlation between the proportion of Maltese and median household income in the United States with a correlation coefficient (R) of 0.125 and weighted average of $97,015, a difference of 5.7%.
Median Household Income Correlation Summary
| Measurement | Immigrants from Australia | Maltese |
| Minimum | $36,932 | $24,250 |
| Maximum | $180,529 | $159,651 |
| Range | $143,597 | $135,401 |
| Mean | $97,516 | $100,571 |
| Median | $99,226 | $97,403 |
| Interquartile 25% (IQ1) | $69,750 | $86,626 |
| Interquartile 75% (IQ3) | $123,199 | $110,225 |
| Interquartile Range (IQR) | $53,449 | $23,599 |
| Standard Deviation (Sample) | $33,443 | $26,669 |
| Standard Deviation (Population) | $33,173 | $26,378 |
Similar Demographics by Median Household Income
Demographics Similar to Immigrants from Australia by Median Household Income
In terms of median household income, the demographic groups most similar to Immigrants from Australia are Cypriot ($102,843, a difference of 0.27%), Bolivian ($102,195, a difference of 0.36%), Immigrants from Korea ($102,962, a difference of 0.39%), Burmese ($103,145, a difference of 0.57%), and Eastern European ($101,781, a difference of 0.77%).
| Demographics | Rating | Rank | Median Household Income |
| Indians (Asian) | 100.0 /100 | #12 | Exceptional $105,262 |
| Immigrants | Eastern Asia | 100.0 /100 | #13 | Exceptional $104,796 |
| Immigrants | Ireland | 100.0 /100 | #14 | Exceptional $104,692 |
| Immigrants | Israel | 100.0 /100 | #15 | Exceptional $104,090 |
| Burmese | 100.0 /100 | #16 | Exceptional $103,145 |
| Immigrants | Korea | 100.0 /100 | #17 | Exceptional $102,962 |
| Cypriots | 100.0 /100 | #18 | Exceptional $102,843 |
| Immigrants | Australia | 100.0 /100 | #19 | Exceptional $102,562 |
| Bolivians | 100.0 /100 | #20 | Exceptional $102,195 |
| Eastern Europeans | 100.0 /100 | #21 | Exceptional $101,781 |
| Asians | 100.0 /100 | #22 | Exceptional $101,681 |
| Immigrants | Bolivia | 100.0 /100 | #23 | Exceptional $101,394 |
| Immigrants | Japan | 100.0 /100 | #24 | Exceptional $100,711 |
| Immigrants | Sweden | 100.0 /100 | #25 | Exceptional $100,699 |
| Immigrants | Belgium | 100.0 /100 | #26 | Exceptional $100,306 |
Demographics Similar to Maltese by Median Household Income
In terms of median household income, the demographic groups most similar to Maltese are Afghan ($97,026, a difference of 0.010%), Immigrants from Turkey ($96,964, a difference of 0.050%), Immigrants from Lithuania ($96,836, a difference of 0.18%), Immigrants from France ($96,743, a difference of 0.28%), and Immigrants from Indonesia ($97,297, a difference of 0.29%).
| Demographics | Rating | Rank | Median Household Income |
| Chinese | 100.0 /100 | #33 | Exceptional $98,496 |
| Russians | 100.0 /100 | #34 | Exceptional $98,008 |
| Immigrants | Switzerland | 100.0 /100 | #35 | Exceptional $97,979 |
| Immigrants | Pakistan | 100.0 /100 | #36 | Exceptional $97,528 |
| Latvians | 100.0 /100 | #37 | Exceptional $97,311 |
| Immigrants | Indonesia | 100.0 /100 | #38 | Exceptional $97,297 |
| Afghans | 100.0 /100 | #39 | Exceptional $97,026 |
| Maltese | 100.0 /100 | #40 | Exceptional $97,015 |
| Immigrants | Turkey | 100.0 /100 | #41 | Exceptional $96,964 |
| Immigrants | Lithuania | 99.9 /100 | #42 | Exceptional $96,836 |
| Immigrants | France | 99.9 /100 | #43 | Exceptional $96,743 |
| Immigrants | Greece | 99.9 /100 | #44 | Exceptional $96,675 |
| Israelis | 99.9 /100 | #45 | Exceptional $96,552 |
| Australians | 99.9 /100 | #46 | Exceptional $96,490 |
| Immigrants | Russia | 99.9 /100 | #47 | Exceptional $96,378 |