Immigrants from Chile vs Honduran 5th Grade
COMPARE
Immigrants from Chile
Honduran
5th Grade
5th Grade Comparison
Immigrants from Chile
Hondurans
97.2%
5TH GRADE
16.6/ 100
METRIC RATING
201st/ 347
METRIC RANK
95.6%
5TH GRADE
0.0/ 100
METRIC RATING
324th/ 347
METRIC RANK
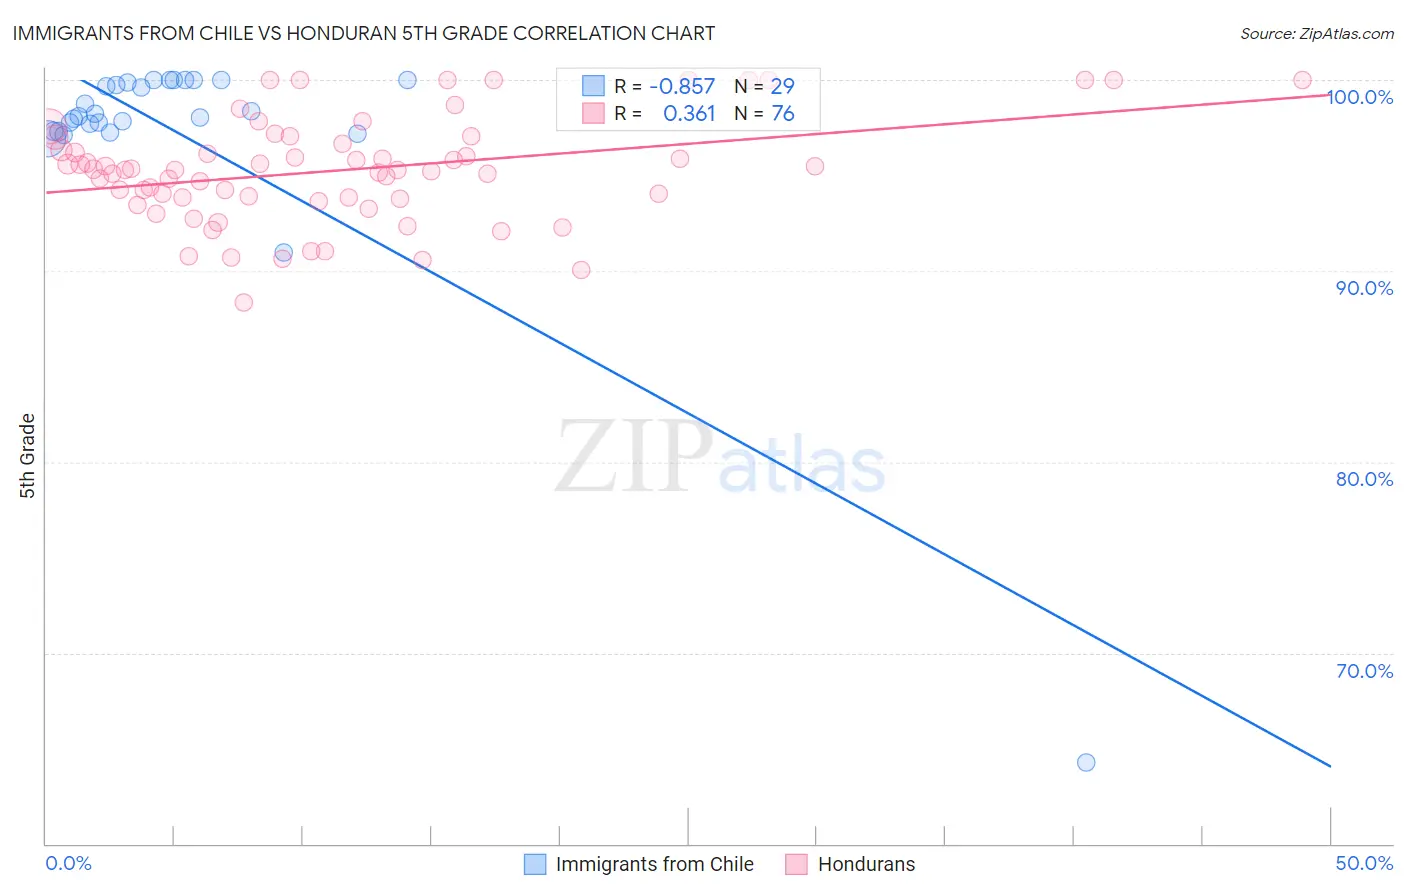
Immigrants from Chile vs Honduran 5th Grade Correlation Chart
The statistical analysis conducted on geographies consisting of 218,647,266 people shows a very strong negative correlation between the proportion of Immigrants from Chile and percentage of population with at least 5th grade education in the United States with a correlation coefficient (R) of -0.857 and weighted average of 97.2%. Similarly, the statistical analysis conducted on geographies consisting of 357,784,803 people shows a mild positive correlation between the proportion of Hondurans and percentage of population with at least 5th grade education in the United States with a correlation coefficient (R) of 0.361 and weighted average of 95.6%, a difference of 1.7%.
5th Grade Correlation Summary
| Measurement | Immigrants from Chile | Honduran |
| Minimum | 64.3% | 88.3% |
| Maximum | 100.0% | 100.0% |
| Range | 35.7% | 11.7% |
| Mean | 97.2% | 95.3% |
| Median | 98.1% | 95.3% |
| Interquartile 25% (IQ1) | 97.3% | 93.8% |
| Interquartile 75% (IQ3) | 99.9% | 96.8% |
| Interquartile Range (IQR) | 2.6% | 3.0% |
| Standard Deviation (Sample) | 6.6% | 2.7% |
| Standard Deviation (Population) | 6.5% | 2.7% |
Similar Demographics by 5th Grade
Demographics Similar to Immigrants from Chile by 5th Grade
In terms of 5th grade, the demographic groups most similar to Immigrants from Chile are Immigrants from Northern Africa (97.2%, a difference of 0.0%), Native/Alaskan (97.2%, a difference of 0.010%), African (97.2%, a difference of 0.010%), Immigrants from Bahamas (97.2%, a difference of 0.010%), and Immigrants from Zaire (97.1%, a difference of 0.020%).
| Demographics | Rating | Rank | 5th Grade |
| Immigrants | Albania | 28.5 /100 | #194 | Fair 97.2% |
| Guamanians/Chamorros | 26.8 /100 | #195 | Fair 97.2% |
| Hawaiians | 25.6 /100 | #196 | Fair 97.2% |
| Brazilians | 25.4 /100 | #197 | Fair 97.2% |
| Immigrants | Uganda | 21.1 /100 | #198 | Fair 97.2% |
| Natives/Alaskans | 18.0 /100 | #199 | Poor 97.2% |
| Immigrants | Northern Africa | 16.8 /100 | #200 | Poor 97.2% |
| Immigrants | Chile | 16.6 /100 | #201 | Poor 97.2% |
| Africans | 15.3 /100 | #202 | Poor 97.2% |
| Immigrants | Bahamas | 14.9 /100 | #203 | Poor 97.2% |
| Immigrants | Zaire | 13.7 /100 | #204 | Poor 97.1% |
| Moroccans | 12.0 /100 | #205 | Poor 97.1% |
| Paiute | 11.6 /100 | #206 | Poor 97.1% |
| Iraqis | 10.9 /100 | #207 | Poor 97.1% |
| Laotians | 10.8 /100 | #208 | Poor 97.1% |
Demographics Similar to Hondurans by 5th Grade
In terms of 5th grade, the demographic groups most similar to Hondurans are Hispanic or Latino (95.6%, a difference of 0.0%), Immigrants from Fiji (95.6%, a difference of 0.020%), Immigrants from Cambodia (95.5%, a difference of 0.030%), Dominican (95.5%, a difference of 0.030%), and Immigrants from Nicaragua (95.6%, a difference of 0.070%).
| Demographics | Rating | Rank | 5th Grade |
| Belizeans | 0.0 /100 | #317 | Tragic 95.8% |
| Immigrants | Vietnam | 0.0 /100 | #318 | Tragic 95.8% |
| Japanese | 0.0 /100 | #319 | Tragic 95.7% |
| Central American Indians | 0.0 /100 | #320 | Tragic 95.7% |
| Immigrants | Belize | 0.0 /100 | #321 | Tragic 95.7% |
| Immigrants | Nicaragua | 0.0 /100 | #322 | Tragic 95.6% |
| Immigrants | Fiji | 0.0 /100 | #323 | Tragic 95.6% |
| Hondurans | 0.0 /100 | #324 | Tragic 95.6% |
| Hispanics or Latinos | 0.0 /100 | #325 | Tragic 95.6% |
| Immigrants | Cambodia | 0.0 /100 | #326 | Tragic 95.5% |
| Dominicans | 0.0 /100 | #327 | Tragic 95.5% |
| Cape Verdeans | 0.0 /100 | #328 | Tragic 95.5% |
| Mexican American Indians | 0.0 /100 | #329 | Tragic 95.5% |
| Immigrants | Armenia | 0.0 /100 | #330 | Tragic 95.4% |
| Immigrants | Honduras | 0.0 /100 | #331 | Tragic 95.4% |