Immigrants from Central America vs Venezuelan 1 or more Vehicles in Household
COMPARE
Immigrants from Central America
Venezuelan
1 or more Vehicles in Household
1 or more Vehicles in Household Comparison
Immigrants from Central America
Venezuelans
91.1%
1 OR MORE VEHICLES IN HOUSEHOLD
98.4/ 100
METRIC RATING
100th/ 347
METRIC RANK
91.9%
1 OR MORE VEHICLES IN HOUSEHOLD
99.8/ 100
METRIC RATING
59th/ 347
METRIC RANK
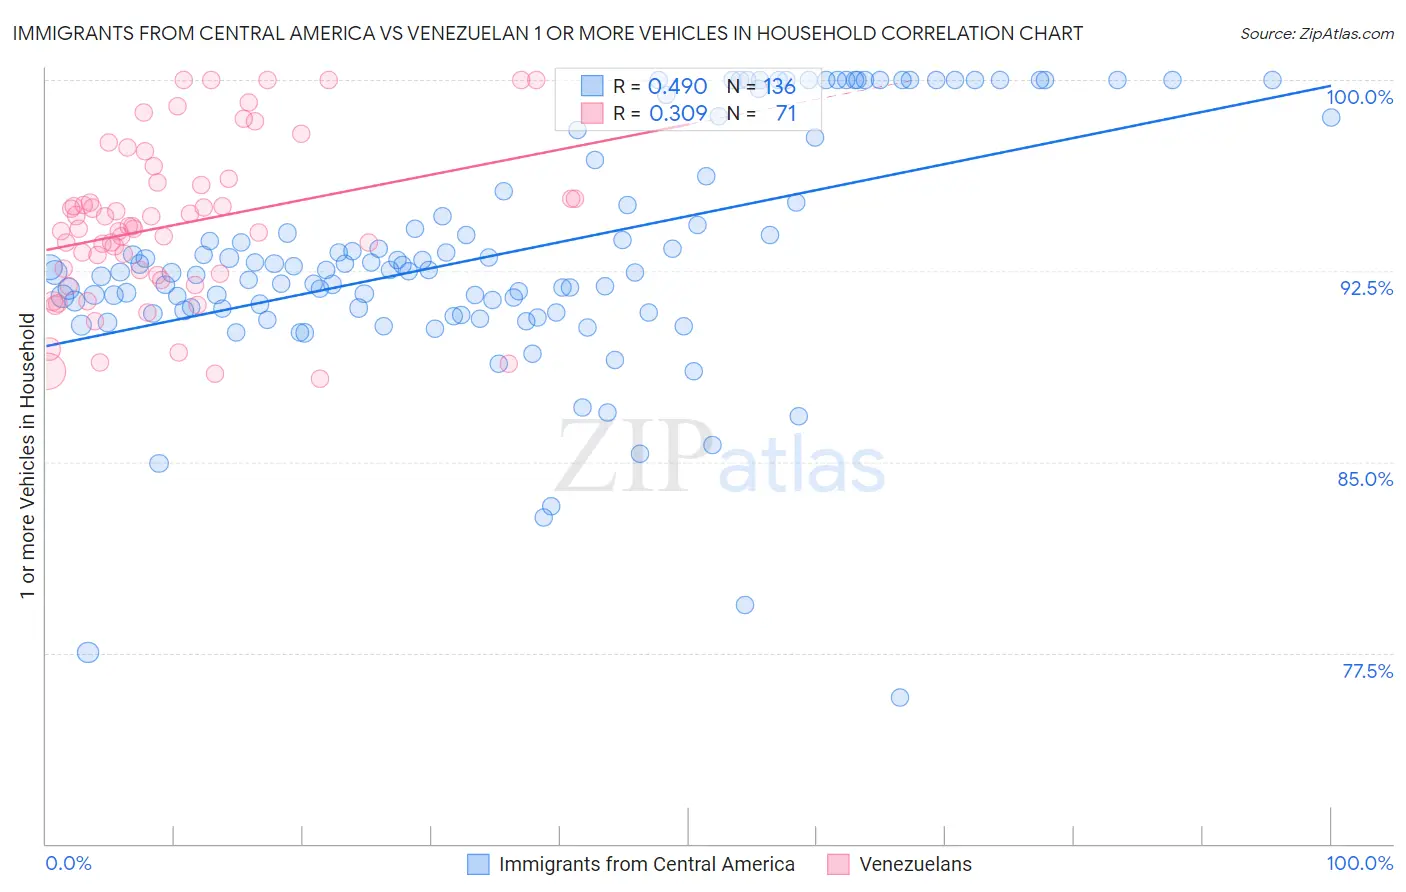
Immigrants from Central America vs Venezuelan 1 or more Vehicles in Household Correlation Chart
The statistical analysis conducted on geographies consisting of 536,152,360 people shows a moderate positive correlation between the proportion of Immigrants from Central America and percentage of households with 1 or more vehicles available in the United States with a correlation coefficient (R) of 0.490 and weighted average of 91.1%. Similarly, the statistical analysis conducted on geographies consisting of 306,174,989 people shows a mild positive correlation between the proportion of Venezuelans and percentage of households with 1 or more vehicles available in the United States with a correlation coefficient (R) of 0.309 and weighted average of 91.9%, a difference of 0.86%.
1 or more Vehicles in Household Correlation Summary
| Measurement | Immigrants from Central America | Venezuelan |
| Minimum | 75.8% | 88.3% |
| Maximum | 100.0% | 100.0% |
| Range | 24.2% | 11.7% |
| Mean | 93.2% | 94.3% |
| Median | 92.5% | 94.2% |
| Interquartile 25% (IQ1) | 91.0% | 92.3% |
| Interquartile 75% (IQ3) | 95.9% | 96.0% |
| Interquartile Range (IQR) | 4.9% | 3.7% |
| Standard Deviation (Sample) | 4.7% | 3.1% |
| Standard Deviation (Population) | 4.7% | 3.1% |
Similar Demographics by 1 or more Vehicles in Household
Demographics Similar to Immigrants from Central America by 1 or more Vehicles in Household
In terms of 1 or more vehicles in household, the demographic groups most similar to Immigrants from Central America are Bulgarian (91.1%, a difference of 0.010%), Seminole (91.1%, a difference of 0.030%), Immigrants from Bolivia (91.2%, a difference of 0.040%), Yugoslavian (91.1%, a difference of 0.040%), and Asian (91.1%, a difference of 0.050%).
| Demographics | Rating | Rank | 1 or more Vehicles in Household |
| Immigrants | North America | 99.2 /100 | #93 | Exceptional 91.4% |
| Immigrants | Cuba | 99.1 /100 | #94 | Exceptional 91.3% |
| Austrians | 99.0 /100 | #95 | Exceptional 91.3% |
| Potawatomi | 99.0 /100 | #96 | Exceptional 91.3% |
| Pakistanis | 99.0 /100 | #97 | Exceptional 91.3% |
| Slavs | 98.7 /100 | #98 | Exceptional 91.2% |
| Immigrants | Bolivia | 98.6 /100 | #99 | Exceptional 91.2% |
| Immigrants | Central America | 98.4 /100 | #100 | Exceptional 91.1% |
| Bulgarians | 98.4 /100 | #101 | Exceptional 91.1% |
| Seminole | 98.3 /100 | #102 | Exceptional 91.1% |
| Yugoslavians | 98.3 /100 | #103 | Exceptional 91.1% |
| Asians | 98.2 /100 | #104 | Exceptional 91.1% |
| Laotians | 98.0 /100 | #105 | Exceptional 91.0% |
| Zimbabweans | 97.7 /100 | #106 | Exceptional 91.0% |
| Maltese | 97.7 /100 | #107 | Exceptional 91.0% |
Demographics Similar to Venezuelans by 1 or more Vehicles in Household
In terms of 1 or more vehicles in household, the demographic groups most similar to Venezuelans are Immigrants from Mexico (91.9%, a difference of 0.010%), Iraqi (91.9%, a difference of 0.030%), Slovak (91.9%, a difference of 0.030%), Immigrants from India (91.9%, a difference of 0.040%), and Thai (91.9%, a difference of 0.040%).
| Demographics | Rating | Rank | 1 or more Vehicles in Household |
| Koreans | 99.9 /100 | #52 | Exceptional 92.1% |
| Hawaiians | 99.9 /100 | #53 | Exceptional 92.0% |
| Slovenes | 99.9 /100 | #54 | Exceptional 92.0% |
| Immigrants | Afghanistan | 99.9 /100 | #55 | Exceptional 92.0% |
| Immigrants | Venezuela | 99.9 /100 | #56 | Exceptional 92.0% |
| Iraqis | 99.8 /100 | #57 | Exceptional 91.9% |
| Immigrants | Mexico | 99.8 /100 | #58 | Exceptional 91.9% |
| Venezuelans | 99.8 /100 | #59 | Exceptional 91.9% |
| Slovaks | 99.8 /100 | #60 | Exceptional 91.9% |
| Immigrants | India | 99.8 /100 | #61 | Exceptional 91.9% |
| Thais | 99.8 /100 | #62 | Exceptional 91.9% |
| Chinese | 99.8 /100 | #63 | Exceptional 91.9% |
| Croatians | 99.8 /100 | #64 | Exceptional 91.9% |
| Immigrants | Laos | 99.8 /100 | #65 | Exceptional 91.8% |
| Canadians | 99.8 /100 | #66 | Exceptional 91.8% |