Immigrants from Central America vs Taiwanese Male Unemployment
COMPARE
Immigrants from Central America
Taiwanese
Male Unemployment
Male Unemployment Comparison
Immigrants from Central America
Taiwanese
5.8%
MALE UNEMPLOYMENT
0.1/ 100
METRIC RATING
260th/ 347
METRIC RANK
5.3%
MALE UNEMPLOYMENT
37.6/ 100
METRIC RATING
183rd/ 347
METRIC RANK
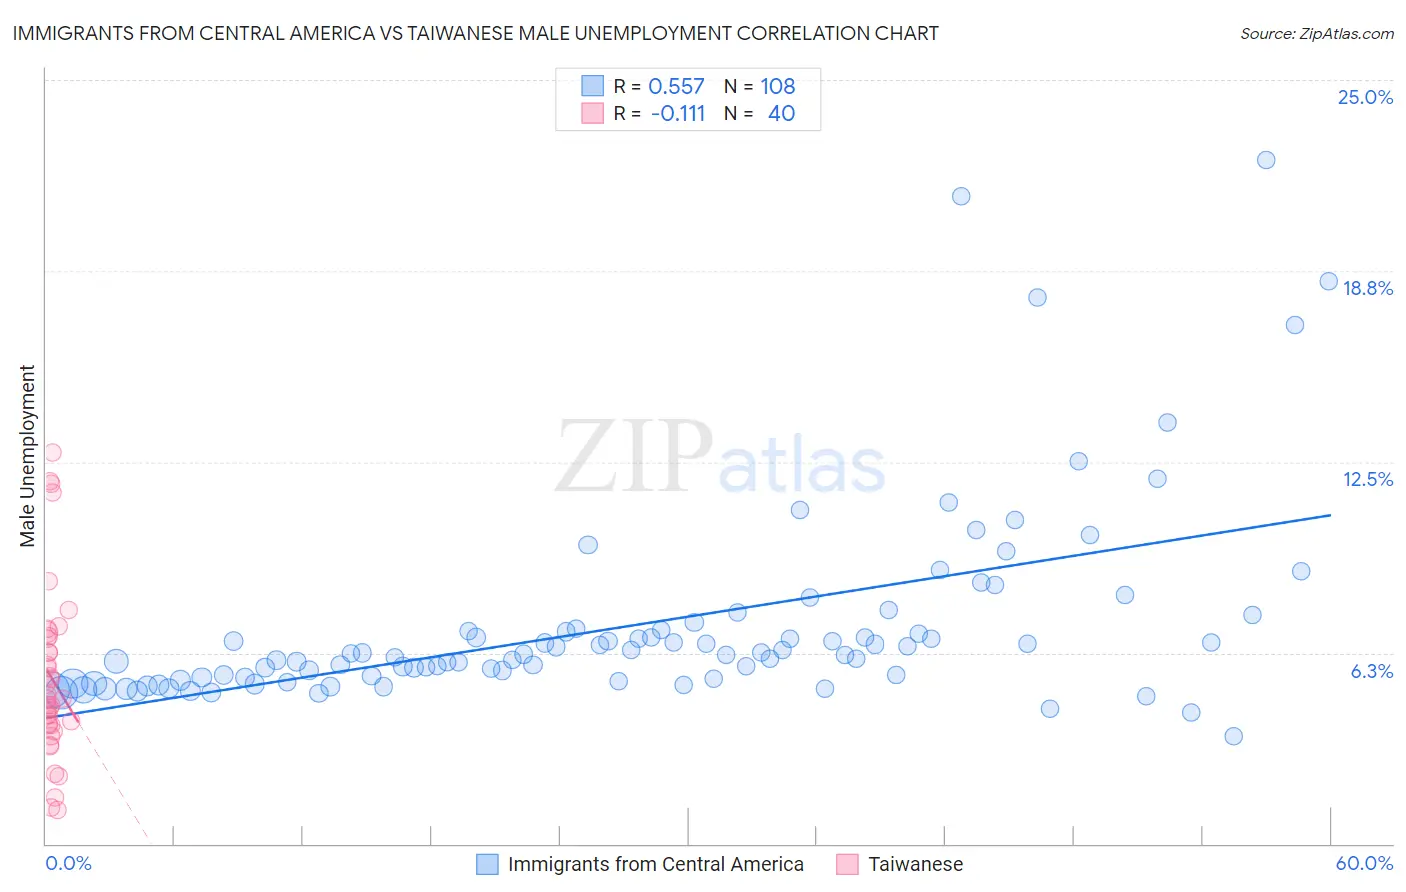
Immigrants from Central America vs Taiwanese Male Unemployment Correlation Chart
The statistical analysis conducted on geographies consisting of 529,817,546 people shows a substantial positive correlation between the proportion of Immigrants from Central America and unemployment rate among males in the United States with a correlation coefficient (R) of 0.557 and weighted average of 5.8%. Similarly, the statistical analysis conducted on geographies consisting of 31,713,095 people shows a poor negative correlation between the proportion of Taiwanese and unemployment rate among males in the United States with a correlation coefficient (R) of -0.111 and weighted average of 5.3%, a difference of 9.2%.
Male Unemployment Correlation Summary
| Measurement | Immigrants from Central America | Taiwanese |
| Minimum | 3.5% | 1.1% |
| Maximum | 22.4% | 12.8% |
| Range | 18.9% | 11.7% |
| Mean | 7.2% | 5.4% |
| Median | 6.2% | 4.7% |
| Interquartile 25% (IQ1) | 5.4% | 3.9% |
| Interquartile 75% (IQ3) | 7.0% | 6.7% |
| Interquartile Range (IQR) | 1.6% | 2.9% |
| Standard Deviation (Sample) | 3.3% | 2.8% |
| Standard Deviation (Population) | 3.2% | 2.8% |
Similar Demographics by Male Unemployment
Demographics Similar to Immigrants from Central America by Male Unemployment
In terms of male unemployment, the demographic groups most similar to Immigrants from Central America are Cajun (5.8%, a difference of 0.060%), Liberian (5.8%, a difference of 0.18%), Dutch West Indian (5.8%, a difference of 0.21%), Hispanic or Latino (5.8%, a difference of 0.35%), and Comanche (5.8%, a difference of 0.52%).
| Demographics | Rating | Rank | Male Unemployment |
| Mexican American Indians | 0.2 /100 | #253 | Tragic 5.8% |
| Japanese | 0.2 /100 | #254 | Tragic 5.8% |
| Kiowa | 0.2 /100 | #255 | Tragic 5.8% |
| Comanche | 0.2 /100 | #256 | Tragic 5.8% |
| Hispanics or Latinos | 0.1 /100 | #257 | Tragic 5.8% |
| Dutch West Indians | 0.1 /100 | #258 | Tragic 5.8% |
| Cajuns | 0.1 /100 | #259 | Tragic 5.8% |
| Immigrants | Central America | 0.1 /100 | #260 | Tragic 5.8% |
| Liberians | 0.1 /100 | #261 | Tragic 5.8% |
| Immigrants | Portugal | 0.1 /100 | #262 | Tragic 5.9% |
| Immigrants | Latin America | 0.1 /100 | #263 | Tragic 5.9% |
| Immigrants | Mexico | 0.0 /100 | #264 | Tragic 5.9% |
| French American Indians | 0.0 /100 | #265 | Tragic 5.9% |
| Bahamians | 0.0 /100 | #266 | Tragic 5.9% |
| Nigerians | 0.0 /100 | #267 | Tragic 5.9% |
Demographics Similar to Taiwanese by Male Unemployment
In terms of male unemployment, the demographic groups most similar to Taiwanese are Potawatomi (5.3%, a difference of 0.010%), Immigrants from Afghanistan (5.3%, a difference of 0.020%), Malaysian (5.3%, a difference of 0.12%), Spaniard (5.3%, a difference of 0.16%), and Korean (5.3%, a difference of 0.17%).
| Demographics | Rating | Rank | Male Unemployment |
| Immigrants | Poland | 46.0 /100 | #176 | Average 5.3% |
| Immigrants | Peru | 44.6 /100 | #177 | Average 5.3% |
| Osage | 42.5 /100 | #178 | Average 5.3% |
| Immigrants | Oceania | 40.8 /100 | #179 | Average 5.3% |
| Malaysians | 39.6 /100 | #180 | Fair 5.3% |
| Immigrants | Afghanistan | 37.9 /100 | #181 | Fair 5.3% |
| Potawatomi | 37.8 /100 | #182 | Fair 5.3% |
| Taiwanese | 37.6 /100 | #183 | Fair 5.3% |
| Spaniards | 35.1 /100 | #184 | Fair 5.3% |
| Koreans | 34.9 /100 | #185 | Fair 5.3% |
| Iraqis | 31.6 /100 | #186 | Fair 5.4% |
| Costa Ricans | 31.3 /100 | #187 | Fair 5.4% |
| Arabs | 30.2 /100 | #188 | Fair 5.4% |
| Immigrants | South America | 29.4 /100 | #189 | Fair 5.4% |
| Immigrants | Uganda | 28.8 /100 | #190 | Fair 5.4% |