Immigrants from Canada vs Indian (Asian) Unemployment Among Ages 35 to 44 years
COMPARE
Immigrants from Canada
Indian (Asian)
Unemployment Among Ages 35 to 44 years
Unemployment Among Ages 35 to 44 years Comparison
Immigrants from Canada
Indians (Asian)
4.5%
UNEMPLOYMENT AMONG AGES 35 TO 44 YEARS
92.3/ 100
METRIC RATING
98th/ 347
METRIC RANK
4.4%
UNEMPLOYMENT AMONG AGES 35 TO 44 YEARS
96.0/ 100
METRIC RATING
78th/ 347
METRIC RANK
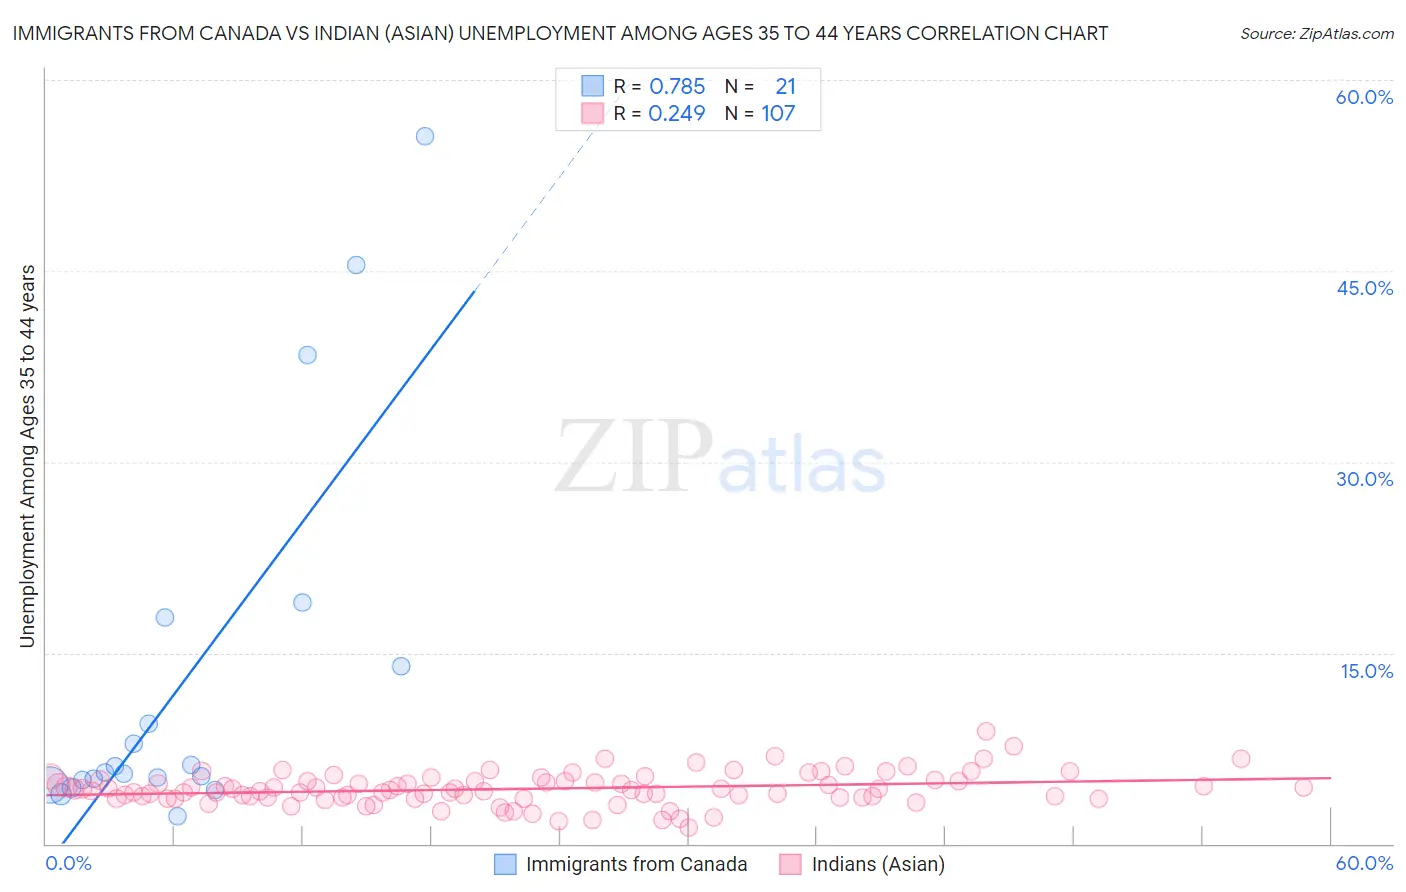
Immigrants from Canada vs Indian (Asian) Unemployment Among Ages 35 to 44 years Correlation Chart
The statistical analysis conducted on geographies consisting of 443,343,768 people shows a strong positive correlation between the proportion of Immigrants from Canada and unemployment rate among population between the ages 35 and 44 in the United States with a correlation coefficient (R) of 0.785 and weighted average of 4.5%. Similarly, the statistical analysis conducted on geographies consisting of 477,470,317 people shows a weak positive correlation between the proportion of Indians (Asian) and unemployment rate among population between the ages 35 and 44 in the United States with a correlation coefficient (R) of 0.249 and weighted average of 4.4%, a difference of 1.3%.
Unemployment Among Ages 35 to 44 years Correlation Summary
| Measurement | Immigrants from Canada | Indian (Asian) |
| Minimum | 2.2% | 1.3% |
| Maximum | 55.6% | 8.8% |
| Range | 53.4% | 7.5% |
| Mean | 12.9% | 4.3% |
| Median | 5.6% | 4.2% |
| Interquartile 25% (IQ1) | 4.8% | 3.6% |
| Interquartile 75% (IQ3) | 15.9% | 5.0% |
| Interquartile Range (IQR) | 11.0% | 1.3% |
| Standard Deviation (Sample) | 15.0% | 1.3% |
| Standard Deviation (Population) | 14.6% | 1.3% |
Demographics Similar to Immigrants from Canada and Indians (Asian) by Unemployment Among Ages 35 to 44 years
In terms of unemployment among ages 35 to 44 years, the demographic groups most similar to Immigrants from Canada are Immigrants from France (4.5%, a difference of 0.050%), Scottish (4.5%, a difference of 0.34%), Yugoslavian (4.5%, a difference of 0.38%), Russian (4.5%, a difference of 0.43%), and Iranian (4.5%, a difference of 0.48%). Similarly, the demographic groups most similar to Indians (Asian) are Immigrants from Sweden (4.4%, a difference of 0.050%), Kenyan (4.4%, a difference of 0.12%), Immigrants from Scotland (4.4%, a difference of 0.17%), Immigrants from Asia (4.4%, a difference of 0.17%), and Immigrants from Australia (4.4%, a difference of 0.31%).
| Demographics | Rating | Rank | Unemployment Among Ages 35 to 44 years |
| Indians (Asian) | 96.0 /100 | #78 | Exceptional 4.4% |
| Immigrants | Sweden | 95.9 /100 | #79 | Exceptional 4.4% |
| Kenyans | 95.7 /100 | #80 | Exceptional 4.4% |
| Immigrants | Scotland | 95.6 /100 | #81 | Exceptional 4.4% |
| Immigrants | Asia | 95.6 /100 | #82 | Exceptional 4.4% |
| Immigrants | Australia | 95.3 /100 | #83 | Exceptional 4.4% |
| Immigrants | Chile | 95.2 /100 | #84 | Exceptional 4.4% |
| Immigrants | Kenya | 95.0 /100 | #85 | Exceptional 4.4% |
| Serbians | 94.9 /100 | #86 | Exceptional 4.4% |
| Immigrants | Bosnia and Herzegovina | 94.8 /100 | #87 | Exceptional 4.4% |
| Immigrants | Latvia | 94.8 /100 | #88 | Exceptional 4.4% |
| Egyptians | 94.5 /100 | #89 | Exceptional 4.5% |
| Australians | 94.5 /100 | #90 | Exceptional 4.5% |
| Immigrants | Northern Europe | 94.3 /100 | #91 | Exceptional 4.5% |
| Estonians | 94.3 /100 | #92 | Exceptional 4.5% |
| Iranians | 93.9 /100 | #93 | Exceptional 4.5% |
| Russians | 93.8 /100 | #94 | Exceptional 4.5% |
| Yugoslavians | 93.6 /100 | #95 | Exceptional 4.5% |
| Scottish | 93.5 /100 | #96 | Exceptional 4.5% |
| Immigrants | France | 92.5 /100 | #97 | Exceptional 4.5% |
| Immigrants | Canada | 92.3 /100 | #98 | Exceptional 4.5% |