Immigrants from Canada vs Indian (Asian) Householder Income Ages 25 - 44 years
COMPARE
Immigrants from Canada
Indian (Asian)
Householder Income Ages 25 - 44 years
Householder Income Ages 25 - 44 years Comparison
Immigrants from Canada
Indians (Asian)
$102,616
HOUSEHOLDER INCOME AGES 25 - 44 YEARS
98.9/ 100
METRIC RATING
88th/ 347
METRIC RANK
$119,496
HOUSEHOLDER INCOME AGES 25 - 44 YEARS
100.0/ 100
METRIC RATING
10th/ 347
METRIC RANK
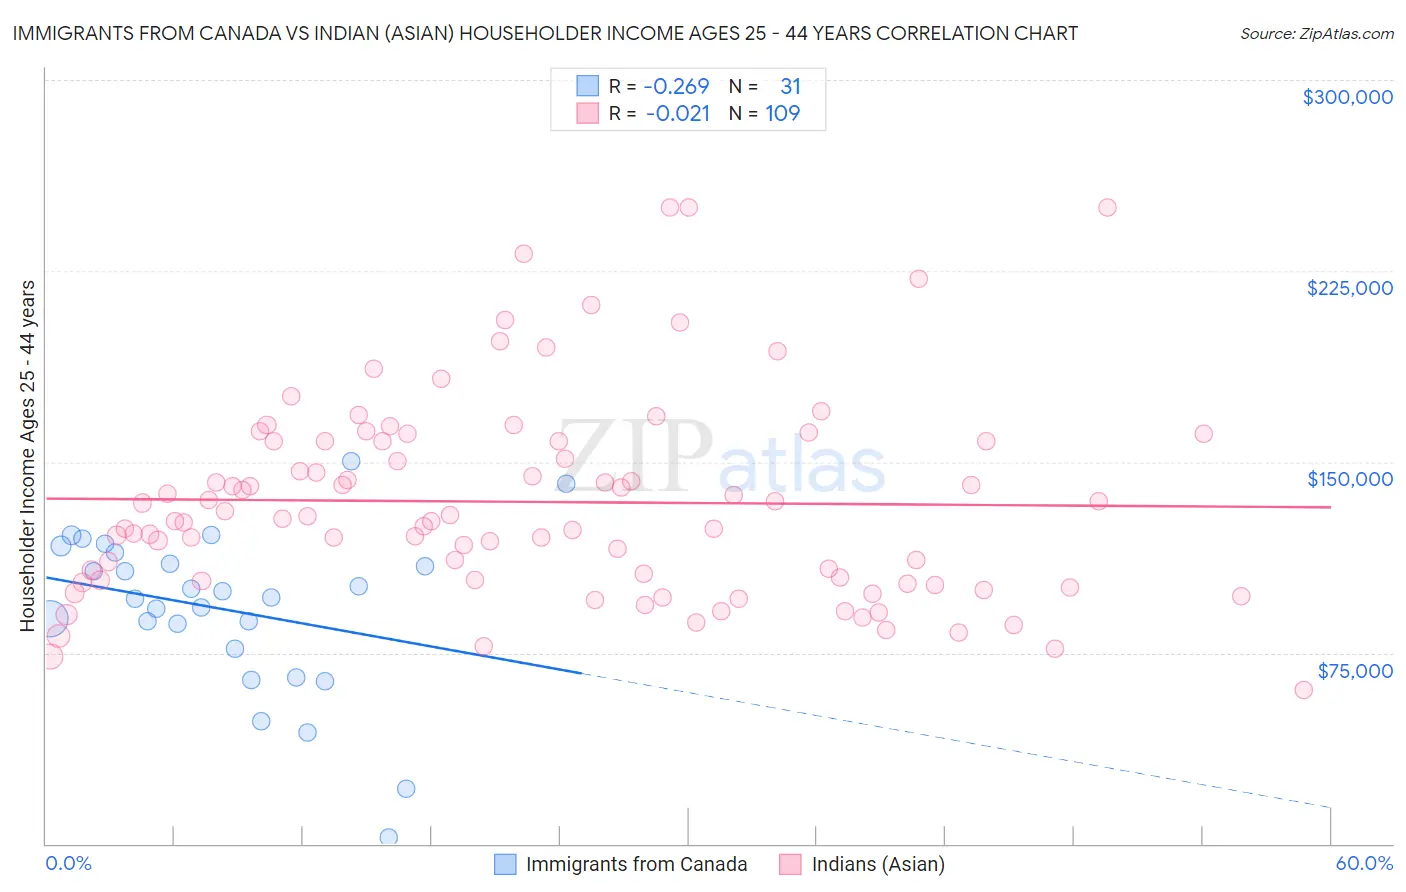
Immigrants from Canada vs Indian (Asian) Householder Income Ages 25 - 44 years Correlation Chart
The statistical analysis conducted on geographies consisting of 457,590,817 people shows a weak negative correlation between the proportion of Immigrants from Canada and household income with householder between the ages 25 and 44 in the United States with a correlation coefficient (R) of -0.269 and weighted average of $102,616. Similarly, the statistical analysis conducted on geographies consisting of 493,231,420 people shows no correlation between the proportion of Indians (Asian) and household income with householder between the ages 25 and 44 in the United States with a correlation coefficient (R) of -0.021 and weighted average of $119,496, a difference of 16.5%.
Householder Income Ages 25 - 44 years Correlation Summary
| Measurement | Immigrants from Canada | Indian (Asian) |
| Minimum | $2,499 | $60,448 |
| Maximum | $150,179 | $250,001 |
| Range | $147,680 | $189,553 |
| Mean | $91,907 | $134,282 |
| Median | $96,656 | $127,538 |
| Interquartile 25% (IQ1) | $76,535 | $103,285 |
| Interquartile 75% (IQ3) | $114,617 | $158,064 |
| Interquartile Range (IQR) | $38,082 | $54,779 |
| Standard Deviation (Sample) | $32,277 | $39,616 |
| Standard Deviation (Population) | $31,752 | $39,434 |
Similar Demographics by Householder Income Ages 25 - 44 years
Demographics Similar to Immigrants from Canada by Householder Income Ages 25 - 44 years
In terms of householder income ages 25 - 44 years, the demographic groups most similar to Immigrants from Canada are Immigrants from Hungary ($102,655, a difference of 0.040%), Immigrants from Western Europe ($102,654, a difference of 0.040%), Immigrants from Ukraine ($102,664, a difference of 0.050%), Romanian ($102,544, a difference of 0.070%), and Ukrainian ($102,451, a difference of 0.16%).
| Demographics | Rating | Rank | Householder Income Ages 25 - 44 years |
| South Africans | 99.2 /100 | #81 | Exceptional $103,160 |
| Immigrants | Serbia | 99.2 /100 | #82 | Exceptional $103,155 |
| Argentineans | 99.1 /100 | #83 | Exceptional $103,111 |
| Immigrants | Philippines | 99.0 /100 | #84 | Exceptional $102,910 |
| Immigrants | Ukraine | 98.9 /100 | #85 | Exceptional $102,664 |
| Immigrants | Hungary | 98.9 /100 | #86 | Exceptional $102,655 |
| Immigrants | Western Europe | 98.9 /100 | #87 | Exceptional $102,654 |
| Immigrants | Canada | 98.9 /100 | #88 | Exceptional $102,616 |
| Romanians | 98.8 /100 | #89 | Exceptional $102,544 |
| Ukrainians | 98.8 /100 | #90 | Exceptional $102,451 |
| Croatians | 98.7 /100 | #91 | Exceptional $102,414 |
| Immigrants | North America | 98.7 /100 | #92 | Exceptional $102,407 |
| Immigrants | England | 98.4 /100 | #93 | Exceptional $102,020 |
| Sri Lankans | 98.4 /100 | #94 | Exceptional $101,960 |
| Assyrians/Chaldeans/Syriacs | 98.3 /100 | #95 | Exceptional $101,936 |
Demographics Similar to Indians (Asian) by Householder Income Ages 25 - 44 years
In terms of householder income ages 25 - 44 years, the demographic groups most similar to Indians (Asian) are Okinawan ($119,349, a difference of 0.12%), Immigrants from China ($119,756, a difference of 0.22%), Immigrants from Iran ($119,204, a difference of 0.25%), Iranian ($120,292, a difference of 0.67%), and Immigrants from Ireland ($120,333, a difference of 0.70%).
| Demographics | Rating | Rank | Householder Income Ages 25 - 44 years |
| Immigrants | Hong Kong | 100.0 /100 | #3 | Exceptional $128,140 |
| Immigrants | Singapore | 100.0 /100 | #4 | Exceptional $124,429 |
| Immigrants | India | 100.0 /100 | #5 | Exceptional $124,238 |
| Thais | 100.0 /100 | #6 | Exceptional $121,778 |
| Immigrants | Ireland | 100.0 /100 | #7 | Exceptional $120,333 |
| Iranians | 100.0 /100 | #8 | Exceptional $120,292 |
| Immigrants | China | 100.0 /100 | #9 | Exceptional $119,756 |
| Indians (Asian) | 100.0 /100 | #10 | Exceptional $119,496 |
| Okinawans | 100.0 /100 | #11 | Exceptional $119,349 |
| Immigrants | Iran | 100.0 /100 | #12 | Exceptional $119,204 |
| Immigrants | Eastern Asia | 100.0 /100 | #13 | Exceptional $118,056 |
| Immigrants | Israel | 100.0 /100 | #14 | Exceptional $117,219 |
| Immigrants | South Central Asia | 100.0 /100 | #15 | Exceptional $116,626 |
| Cypriots | 100.0 /100 | #16 | Exceptional $116,364 |
| Immigrants | Australia | 100.0 /100 | #17 | Exceptional $115,947 |