Immigrants from Syria vs Portuguese Median Family Income

COMPARE

Immigrants from Syria
Race
Ancestry
AfghanAfricanAlaska NativeAlaskan AthabascanAlbanianAleutAlsatianAmericanApacheArabArapahoArgentineanArmenianAssyrian/Chaldean/SyriacAustralianAustrianBahamianBangladeshiBarbadianBasqueBelgianBelizeanBermudanBhutaneseBlackfeetBolivianBrazilianBritishBritish West IndianBulgarianBurmeseCajunCambodianCanadianCape VerdeanCarpatho RusynCelticCentral AmericanCentral American IndianCherokeeCheyenneChickasawChileanChineseChippewaChoctawColombianColvilleComancheCosta RicanCreeCreekCroatianCrowCubanCypriotCzechCzechoslovakianDanishDelawareDominicanDutchDutch West IndianEastern EuropeanEcuadorianEgyptianEnglishEstonianEthiopianEuropeanFijianFilipinoFinnishFrenchFrench American IndianFrench CanadianGermanGerman RussianGhanaianGreekGuamanian/ChamorroGuatemalanGuyaneseHaitianHmongHonduranHopiHoumaHungarianIcelanderIndian (Asian)IndonesianInupiatIranianIraqiIrishIroquoisIsraeliItalianJamaicanJapaneseJordanianKenyanKiowaKoreanLaotianLatvianLebaneseLiberianLithuanianLumbeeLuxembourgerMacedonianMalaysianMalteseMarshalleseMenomineeMexicanMexican American IndianMongolianMoroccanNative HawaiianNavajoNepaleseNew ZealanderNicaraguanNigerianNorthern EuropeanNorwegianOkinawanOsageOttawaPaiutePakistaniPalestinianPanamanianParaguayanPennsylvania GermanPeruvianPimaPolishPotawatomiPuebloPuerto RicanPuget Sound SalishRomanianRussianSalvadoranSamoanScandinavianScotch-IrishScottishSeminoleSenegaleseSerbianShoshoneSierra LeoneanSiouxSlavicSlovakSloveneSomaliSouth AfricanSouth AmericanSouth American IndianSoviet UnionSpaniardSpanishSpanish AmericanSpanish American IndianSri LankanSubsaharan AfricanSudaneseSwedishSwissSyrianTaiwaneseThaiTlingit-HaidaTohono O'OdhamTonganTrinidadian and TobagonianTsimshianTurkishU.S. Virgin IslanderUgandanUkrainianUruguayanUteVenezuelanVietnameseWelshWest IndianYakamaYaquiYugoslavianYumanYup'ikZimbabwean
Immigration
NonimmigrantsImmigrantsAfghanistanAfricaAlbaniaArgentinaArmeniaAsiaAustraliaAustriaBahamasBangladeshBarbadosBelarusBelgiumBelizeBoliviaBosnia and HerzegovinaBrazilBulgariaBurma/MyanmarCabo VerdeCambodiaCameroonCanadaCaribbeanCentral AmericaChileChinaColombiaCongoCosta RicaCroatiaCubaCzechoslovakiaDenmarkDominicaDominican RepublicEastern AfricaEastern AsiaEastern EuropeEcuadorEgyptEl SalvadorEnglandEritreaEthiopiaEuropeFijiFranceGermanyGhanaGreeceGrenadaGuatemalaGuyanaHaitiHondurasHong KongHungaryIndiaIndonesiaIranIraqIrelandIsraelItalyJamaicaJapanJordanKazakhstanKenyaKoreaKuwaitLaosLatin AmericaLatviaLebanonLiberiaLithuaniaMalaysiaMexicoMicronesiaMiddle AfricaMoldovaMoroccoNepalNetherlandsNicaraguaNigeriaNorth AmericaNorth MacedoniaNorthern AfricaNorthern EuropeNorwayOceaniaPakistanPanamaPeruPhilippinesPolandPortugalRomaniaRussiaSaudi ArabiaScotlandSenegalSerbiaSierra LeoneSingaporeSomaliaSouth AfricaSouth AmericaSouth Central AsiaSouth Eastern AsiaSouthern EuropeSpainSri LankaSt. Vincent and the GrenadinesSudanSwedenSwitzerlandSyriaTaiwanThailandTrinidad and TobagoTurkeyUgandaUkraineUruguayUzbekistanVenezuelaVietnamWest IndiesWestern AfricaWestern AsiaWestern EuropeYemenZaireZimbabweAzores
Portuguese
Race
Ancestry
AfghanAfricanAlaska NativeAlaskan AthabascanAlbanianAleutAlsatianAmericanApacheArabArapahoArgentineanArmenianAssyrian/Chaldean/SyriacAustralianAustrianBahamianBangladeshiBarbadianBasqueBelgianBelizeanBermudanBhutaneseBlackfeetBolivianBrazilianBritishBritish West IndianBulgarianBurmeseCajunCambodianCanadianCape VerdeanCarpatho RusynCelticCentral AmericanCentral American IndianCherokeeCheyenneChickasawChileanChineseChippewaChoctawColombianColvilleComancheCosta RicanCreeCreekCroatianCrowCubanCypriotCzechCzechoslovakianDanishDelawareDominicanDutchDutch West IndianEastern EuropeanEcuadorianEgyptianEnglishEstonianEthiopianEuropeanFijianFilipinoFinnishFrenchFrench American IndianFrench CanadianGermanGerman RussianGhanaianGreekGuamanian/ChamorroGuatemalanGuyaneseHaitianHmongHonduranHopiHoumaHungarianIcelanderIndian (Asian)IndonesianInupiatIranianIraqiIrishIroquoisIsraeliItalianJamaicanJapaneseJordanianKenyanKiowaKoreanLaotianLatvianLebaneseLiberianLithuanianLumbeeLuxembourgerMacedonianMalaysianMalteseMarshalleseMenomineeMexicanMexican American IndianMongolianMoroccanNative HawaiianNavajoNepaleseNew ZealanderNicaraguanNigerianNorthern EuropeanNorwegianOkinawanOsageOttawaPaiutePakistaniPalestinianPanamanianParaguayanPennsylvania GermanPeruvianPimaPolishPortuguesePotawatomiPuebloPuerto RicanPuget Sound SalishRomanianRussianSalvadoranSamoanScandinavianScotch-IrishScottishSeminoleSenegaleseSerbianShoshoneSierra LeoneanSiouxSlavicSlovakSloveneSomaliSouth AfricanSouth AmericanSouth American IndianSoviet UnionSpaniardSpanishSpanish AmericanSpanish American IndianSri LankanSubsaharan AfricanSudaneseSwedishSwissSyrianTaiwaneseThaiTlingit-HaidaTohono O'OdhamTonganTrinidadian and TobagonianTsimshianTurkishU.S. Virgin IslanderUgandanUkrainianUruguayanUteVenezuelanVietnameseWelshWest IndianYakamaYaquiYugoslavianYumanYup'ikZimbabwean
Immigration
NonimmigrantsImmigrantsAfghanistanAfricaAlbaniaArgentinaArmeniaAsiaAustraliaAustriaBahamasBangladeshBarbadosBelarusBelgiumBelizeBoliviaBosnia and HerzegovinaBrazilBulgariaBurma/MyanmarCabo VerdeCambodiaCameroonCanadaCaribbeanCentral AmericaChileChinaColombiaCongoCosta RicaCroatiaCubaCzechoslovakiaDenmarkDominicaDominican RepublicEastern AfricaEastern AsiaEastern EuropeEcuadorEgyptEl SalvadorEnglandEritreaEthiopiaEuropeFijiFranceGermanyGhanaGreeceGrenadaGuatemalaGuyanaHaitiHondurasHong KongHungaryIndiaIndonesiaIranIraqIrelandIsraelItalyJamaicaJapanJordanKazakhstanKenyaKoreaKuwaitLaosLatin AmericaLatviaLebanonLiberiaLithuaniaMalaysiaMexicoMicronesiaMiddle AfricaMoldovaMoroccoNepalNetherlandsNicaraguaNigeriaNorth AmericaNorth MacedoniaNorthern AfricaNorthern EuropeNorwayOceaniaPakistanPanamaPeruPhilippinesPolandPortugalRomaniaRussiaSaudi ArabiaScotlandSenegalSerbiaSierra LeoneSingaporeSomaliaSouth AfricaSouth AmericaSouth Central AsiaSouth Eastern AsiaSouthern EuropeSpainSri LankaSt. Vincent and the GrenadinesSudanSwedenSwitzerlandTaiwanThailandTrinidad and TobagoTurkeyUgandaUkraineUruguayUzbekistanVenezuelaVietnamWest IndiesWestern AfricaWestern AsiaWestern EuropeYemenZaireZimbabweAzores
Median Family Income
Income
Poverty
Unemployment
Labor Participation
Family Structure
Vehicle Availability
Education Level
Disability

Median Family Income Comparison

Immigrants from Syria

Portuguese

Excellent
Excellent
$106,118
MEDIAN FAMILY INCOME
85.3/ 100
METRIC RATING
141st/ 347
METRIC RANK
$106,286
MEDIAN FAMILY INCOME
86.3/ 100
METRIC RATING
135th/ 347
METRIC RANK

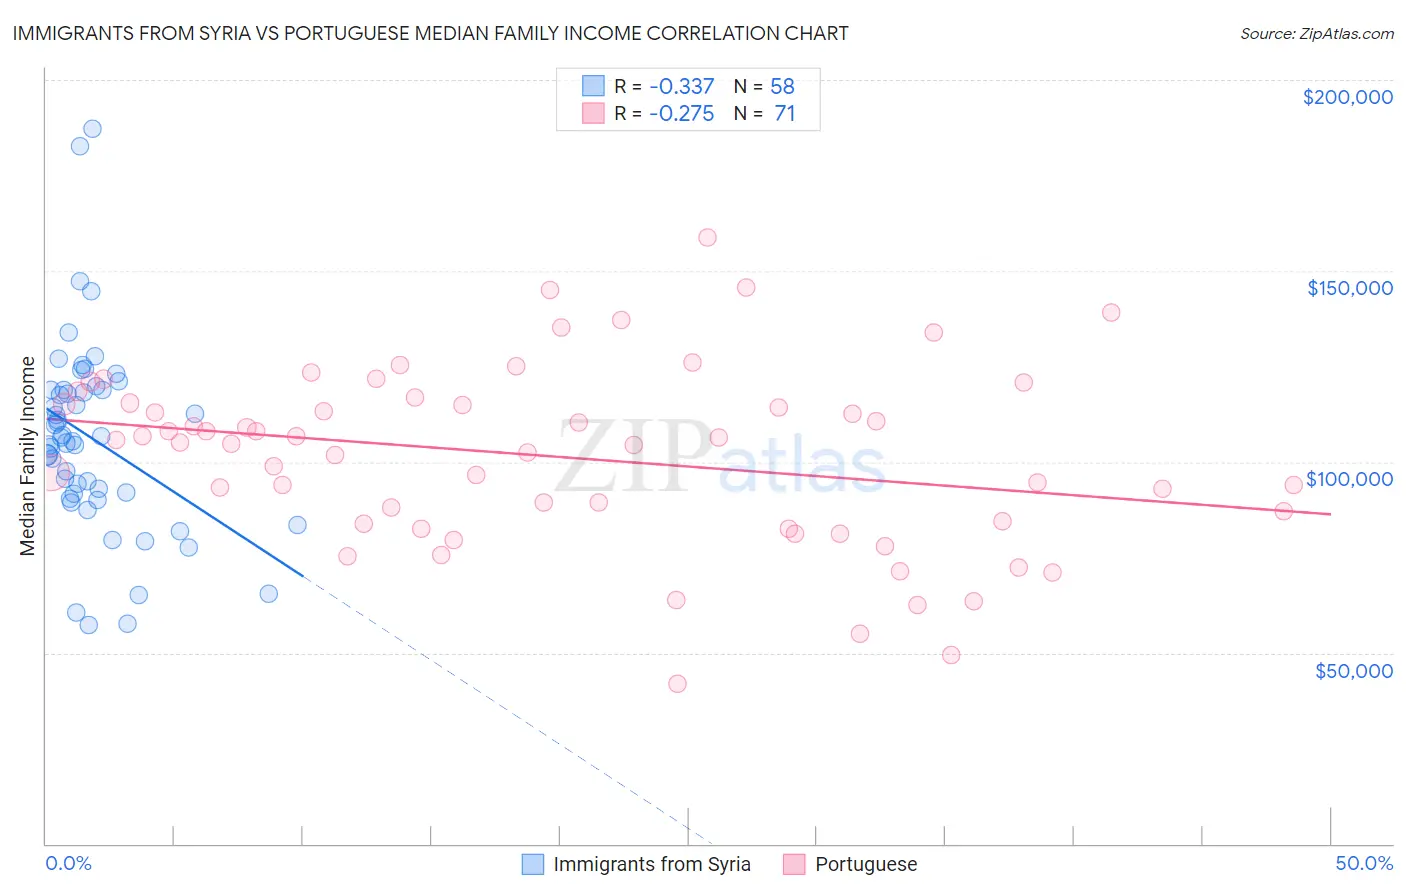
Immigrants from Syria vs Portuguese Median Family Income Correlation Chart

The statistical analysis conducted on geographies consisting of 174,073,283 people shows a mild negative correlation between the proportion of Immigrants from Syria and median family income in the United States with a correlation coefficient (R) of -0.337 and weighted average of $106,118. Similarly, the statistical analysis conducted on geographies consisting of 449,790,054 people shows a weak negative correlation between the proportion of Portuguese and median family income in the United States with a correlation coefficient (R) of -0.275 and weighted average of $106,286, a difference of 0.16%.
Immigrants from Syria vs Portuguese Median Family Income

Median Family Income Correlation Summary

MeasurementImmigrants from SyriaPortuguese
Minimum$57,198$41,875
Maximum$187,321$158,667
Range$130,123$116,792
Mean$106,113$101,290
Median$105,890$105,008
Interquartile 25% (IQ1)$91,647$83,759
Interquartile 75% (IQ3)$118,687$115,390
Interquartile Range (IQR)$27,040$31,631
Standard Deviation (Sample)$25,104$23,601
Standard Deviation (Population)$24,886$23,434

Demographics Similar to Immigrants from Syria and Portuguese by Median Family Income

In terms of median family income, the demographic groups most similar to Immigrants from Syria are Norwegian ($106,144, a difference of 0.020%), Immigrants from Vietnam ($106,186, a difference of 0.060%), Luxembourger ($106,183, a difference of 0.060%), Immigrants from Uganda ($106,188, a difference of 0.070%), and Slovene ($106,020, a difference of 0.090%). Similarly, the demographic groups most similar to Portuguese are Immigrants from South Eastern Asia ($106,252, a difference of 0.030%), Immigrants from Uganda ($106,188, a difference of 0.090%), Immigrants from Vietnam ($106,186, a difference of 0.090%), Luxembourger ($106,183, a difference of 0.10%), and Norwegian ($106,144, a difference of 0.13%).
DemographicsRating | RankMedian Family Income
Immigrants | Ethiopia
90.0
/100
|
#128
Excellent
$106,969
Arabs
89.9
/100
|
#129
Excellent
$106,952
Brazilians
89.8
/100
|
#130
Excellent
$106,942
Canadians
88.1
/100
|
#131
Excellent
$106,597
Immigrants | Fiji
87.8
/100
|
#132
Excellent
$106,544
Ugandans
87.8
/100
|
#133
Excellent
$106,541
Immigrants | Oceania
87.3
/100
|
#134
Excellent
$106,453
Portuguese
86.3
/100
|
#135
Excellent
$106,286
Immigrants | South Eastern Asia
86.1
/100
|
#136
Excellent
$106,252
Immigrants | Uganda
85.7
/100
|
#137
Excellent
$106,188
Immigrants | Vietnam
85.7
/100
|
#138
Excellent
$106,186
Luxembourgers
85.7
/100
|
#139
Excellent
$106,183
Norwegians
85.5
/100
|
#140
Excellent
$106,144
Immigrants | Syria
85.3
/100
|
#141
Excellent
$106,118
Slovenes
84.7
/100
|
#142
Excellent
$106,020
Tongans
84.3
/100
|
#143
Excellent
$105,967
Immigrants | Morocco
84.3
/100
|
#144
Excellent
$105,964
Danes
83.8
/100
|
#145
Excellent
$105,900
Czechs
83.4
/100
|
#146
Excellent
$105,839
Immigrants | Chile
82.1
/100
|
#147
Excellent
$105,655
Hungarians
81.7
/100
|
#148
Excellent
$105,609