Immigrants from Cambodia vs Immigrants from Iraq Householder Income Ages 25 - 44 years
COMPARE
Immigrants from Cambodia
Immigrants from Iraq
Householder Income Ages 25 - 44 years
Householder Income Ages 25 - 44 years Comparison
Immigrants from Cambodia
Immigrants from Iraq
$91,533
HOUSEHOLDER INCOME AGES 25 - 44 YEARS
15.7/ 100
METRIC RATING
203rd/ 347
METRIC RANK
$89,444
HOUSEHOLDER INCOME AGES 25 - 44 YEARS
5.5/ 100
METRIC RATING
226th/ 347
METRIC RANK
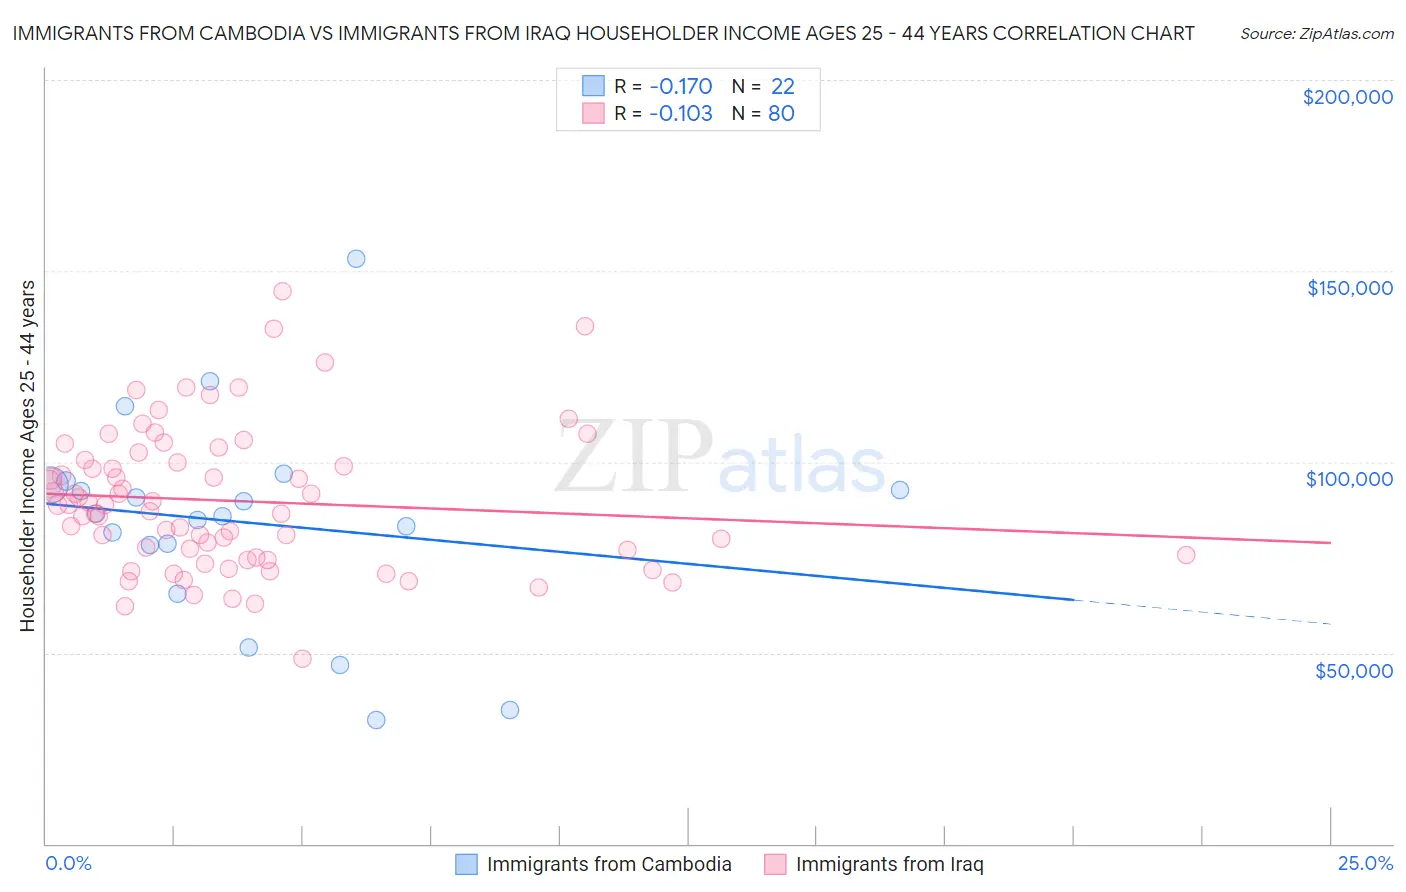
Immigrants from Cambodia vs Immigrants from Iraq Householder Income Ages 25 - 44 years Correlation Chart
The statistical analysis conducted on geographies consisting of 205,045,995 people shows a poor negative correlation between the proportion of Immigrants from Cambodia and household income with householder between the ages 25 and 44 in the United States with a correlation coefficient (R) of -0.170 and weighted average of $91,533. Similarly, the statistical analysis conducted on geographies consisting of 194,665,835 people shows a poor negative correlation between the proportion of Immigrants from Iraq and household income with householder between the ages 25 and 44 in the United States with a correlation coefficient (R) of -0.103 and weighted average of $89,444, a difference of 2.3%.
Householder Income Ages 25 - 44 years Correlation Summary
| Measurement | Immigrants from Cambodia | Immigrants from Iraq |
| Minimum | $32,434 | $48,509 |
| Maximum | $153,083 | $144,841 |
| Range | $120,649 | $96,332 |
| Mean | $84,078 | $89,769 |
| Median | $86,079 | $88,796 |
| Interquartile 25% (IQ1) | $78,256 | $75,233 |
| Interquartile 75% (IQ3) | $93,913 | $100,185 |
| Interquartile Range (IQR) | $15,657 | $24,952 |
| Standard Deviation (Sample) | $27,275 | $18,567 |
| Standard Deviation (Population) | $26,648 | $18,451 |
Similar Demographics by Householder Income Ages 25 - 44 years
Demographics Similar to Immigrants from Cambodia by Householder Income Ages 25 - 44 years
In terms of householder income ages 25 - 44 years, the demographic groups most similar to Immigrants from Cambodia are Ecuadorian ($91,574, a difference of 0.040%), Nepalese ($91,498, a difference of 0.040%), Immigrants from Eastern Africa ($91,458, a difference of 0.080%), Japanese ($91,624, a difference of 0.10%), and White/Caucasian ($91,668, a difference of 0.15%).
| Demographics | Rating | Rank | Householder Income Ages 25 - 44 years |
| Immigrants | Colombia | 21.3 /100 | #196 | Fair $92,204 |
| Spanish | 21.2 /100 | #197 | Fair $92,200 |
| Vietnamese | 20.2 /100 | #198 | Fair $92,089 |
| Kenyans | 16.8 /100 | #199 | Poor $91,684 |
| Whites/Caucasians | 16.7 /100 | #200 | Poor $91,668 |
| Japanese | 16.4 /100 | #201 | Poor $91,624 |
| Ecuadorians | 16.0 /100 | #202 | Poor $91,574 |
| Immigrants | Cambodia | 15.7 /100 | #203 | Poor $91,533 |
| Nepalese | 15.4 /100 | #204 | Poor $91,498 |
| Immigrants | Eastern Africa | 15.2 /100 | #205 | Poor $91,458 |
| Aleuts | 14.5 /100 | #206 | Poor $91,370 |
| Yugoslavians | 14.5 /100 | #207 | Poor $91,368 |
| Immigrants | Thailand | 14.3 /100 | #208 | Poor $91,337 |
| Immigrants | Uruguay | 13.2 /100 | #209 | Poor $91,171 |
| Immigrants | Kenya | 10.9 /100 | #210 | Poor $90,767 |
Demographics Similar to Immigrants from Iraq by Householder Income Ages 25 - 44 years
In terms of householder income ages 25 - 44 years, the demographic groups most similar to Immigrants from Iraq are Immigrants from Panama ($89,451, a difference of 0.010%), Barbadian ($89,565, a difference of 0.14%), Immigrants from Guyana ($89,586, a difference of 0.16%), Immigrants from Ecuador ($89,673, a difference of 0.26%), and Immigrants from Trinidad and Tobago ($89,748, a difference of 0.34%).
| Demographics | Rating | Rank | Householder Income Ages 25 - 44 years |
| Delaware | 6.9 /100 | #219 | Tragic $89,876 |
| Trinidadians and Tobagonians | 6.8 /100 | #220 | Tragic $89,856 |
| Immigrants | Trinidad and Tobago | 6.5 /100 | #221 | Tragic $89,748 |
| Immigrants | Ecuador | 6.2 /100 | #222 | Tragic $89,673 |
| Immigrants | Guyana | 5.9 /100 | #223 | Tragic $89,586 |
| Barbadians | 5.9 /100 | #224 | Tragic $89,565 |
| Immigrants | Panama | 5.5 /100 | #225 | Tragic $89,451 |
| Immigrants | Iraq | 5.5 /100 | #226 | Tragic $89,444 |
| Immigrants | St. Vincent and the Grenadines | 4.1 /100 | #227 | Tragic $88,888 |
| Immigrants | Bosnia and Herzegovina | 4.0 /100 | #228 | Tragic $88,819 |
| Immigrants | Barbados | 3.7 /100 | #229 | Tragic $88,687 |
| Alaskan Athabascans | 3.3 /100 | #230 | Tragic $88,446 |
| Immigrants | Grenada | 3.0 /100 | #231 | Tragic $88,311 |
| Immigrants | Nonimmigrants | 3.0 /100 | #232 | Tragic $88,301 |
| Malaysians | 3.0 /100 | #233 | Tragic $88,291 |