Immigrants from Cabo Verde vs Immigrants from Colombia Unemployment Among Ages 65 to 74 years
COMPARE
Immigrants from Cabo Verde
Immigrants from Colombia
Unemployment Among Ages 65 to 74 years
Unemployment Among Ages 65 to 74 years Comparison
Immigrants from Cabo Verde
Immigrants from Colombia
5.3%
UNEMPLOYMENT AMONG AGES 65 TO 74 YEARS
72.5/ 100
METRIC RATING
153rd/ 347
METRIC RANK
5.7%
UNEMPLOYMENT AMONG AGES 65 TO 74 YEARS
0.1/ 100
METRIC RATING
269th/ 347
METRIC RANK
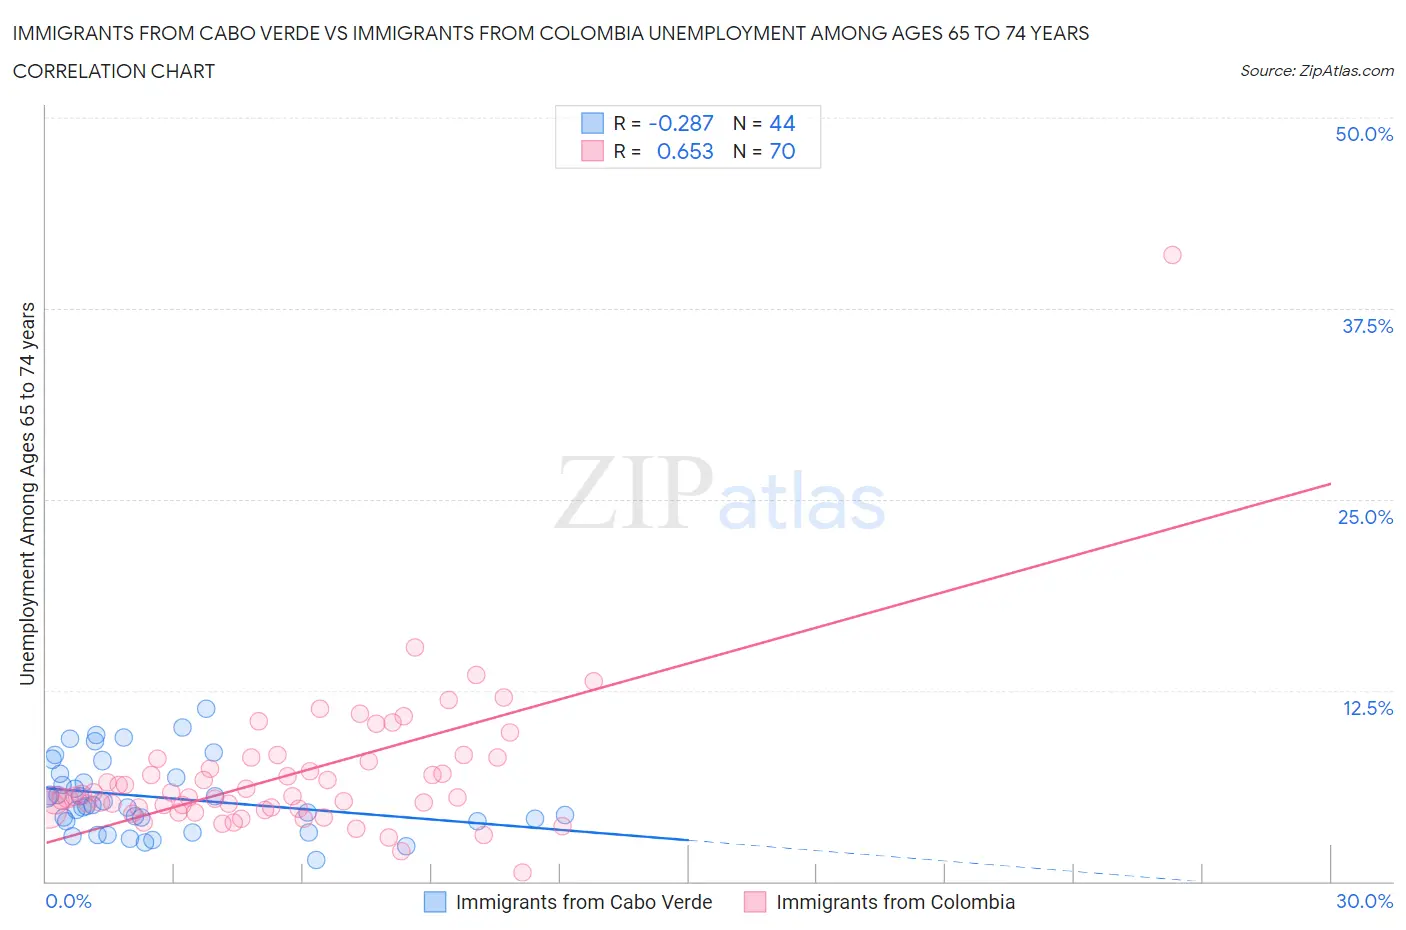
Immigrants from Cabo Verde vs Immigrants from Colombia Unemployment Among Ages 65 to 74 years Correlation Chart
The statistical analysis conducted on geographies consisting of 36,895,301 people shows a weak negative correlation between the proportion of Immigrants from Cabo Verde and unemployment rate among population between the ages 65 and 74 in the United States with a correlation coefficient (R) of -0.287 and weighted average of 5.3%. Similarly, the statistical analysis conducted on geographies consisting of 338,054,875 people shows a significant positive correlation between the proportion of Immigrants from Colombia and unemployment rate among population between the ages 65 and 74 in the United States with a correlation coefficient (R) of 0.653 and weighted average of 5.7%, a difference of 6.3%.
Unemployment Among Ages 65 to 74 years Correlation Summary
| Measurement | Immigrants from Cabo Verde | Immigrants from Colombia |
| Minimum | 1.4% | 0.60% |
| Maximum | 11.3% | 41.0% |
| Range | 9.9% | 40.4% |
| Mean | 5.5% | 7.0% |
| Median | 5.0% | 5.6% |
| Interquartile 25% (IQ1) | 3.9% | 4.8% |
| Interquartile 75% (IQ3) | 6.9% | 8.0% |
| Interquartile Range (IQR) | 3.0% | 3.2% |
| Standard Deviation (Sample) | 2.4% | 5.0% |
| Standard Deviation (Population) | 2.4% | 5.0% |
Similar Demographics by Unemployment Among Ages 65 to 74 years
Demographics Similar to Immigrants from Cabo Verde by Unemployment Among Ages 65 to 74 years
In terms of unemployment among ages 65 to 74 years, the demographic groups most similar to Immigrants from Cabo Verde are Polish (5.3%, a difference of 0.0%), Spanish (5.3%, a difference of 0.010%), Immigrants from Indonesia (5.3%, a difference of 0.020%), Immigrants from Cameroon (5.3%, a difference of 0.020%), and Dutch (5.3%, a difference of 0.020%).
| Demographics | Rating | Rank | Unemployment Among Ages 65 to 74 years |
| Irish | 74.8 /100 | #146 | Good 5.3% |
| Immigrants | Latvia | 74.6 /100 | #147 | Good 5.3% |
| Immigrants | Sri Lanka | 73.8 /100 | #148 | Good 5.3% |
| Immigrants | Romania | 73.5 /100 | #149 | Good 5.3% |
| Immigrants | Poland | 73.2 /100 | #150 | Good 5.3% |
| Immigrants | Indonesia | 72.9 /100 | #151 | Good 5.3% |
| Spanish | 72.6 /100 | #152 | Good 5.3% |
| Immigrants | Cabo Verde | 72.5 /100 | #153 | Good 5.3% |
| Poles | 72.4 /100 | #154 | Good 5.3% |
| Immigrants | Cameroon | 72.1 /100 | #155 | Good 5.3% |
| Dutch | 72.0 /100 | #156 | Good 5.3% |
| Immigrants | Eastern Europe | 71.5 /100 | #157 | Good 5.3% |
| Immigrants | France | 71.0 /100 | #158 | Good 5.3% |
| Immigrants | Czechoslovakia | 66.3 /100 | #159 | Good 5.3% |
| Bangladeshis | 65.8 /100 | #160 | Good 5.3% |
Demographics Similar to Immigrants from Colombia by Unemployment Among Ages 65 to 74 years
In terms of unemployment among ages 65 to 74 years, the demographic groups most similar to Immigrants from Colombia are Immigrants from Nigeria (5.7%, a difference of 0.030%), Belizean (5.7%, a difference of 0.050%), Yaqui (5.7%, a difference of 0.070%), Hawaiian (5.7%, a difference of 0.080%), and Bahamian (5.7%, a difference of 0.090%).
| Demographics | Rating | Rank | Unemployment Among Ages 65 to 74 years |
| Immigrants | St. Vincent and the Grenadines | 0.2 /100 | #262 | Tragic 5.6% |
| Immigrants | Jamaica | 0.2 /100 | #263 | Tragic 5.6% |
| Pueblo | 0.2 /100 | #264 | Tragic 5.6% |
| Jamaicans | 0.2 /100 | #265 | Tragic 5.6% |
| French Canadians | 0.2 /100 | #266 | Tragic 5.6% |
| Guyanese | 0.2 /100 | #267 | Tragic 5.6% |
| Hawaiians | 0.2 /100 | #268 | Tragic 5.7% |
| Immigrants | Colombia | 0.1 /100 | #269 | Tragic 5.7% |
| Immigrants | Nigeria | 0.1 /100 | #270 | Tragic 5.7% |
| Belizeans | 0.1 /100 | #271 | Tragic 5.7% |
| Yaqui | 0.1 /100 | #272 | Tragic 5.7% |
| Bahamians | 0.1 /100 | #273 | Tragic 5.7% |
| Immigrants | Guyana | 0.1 /100 | #274 | Tragic 5.7% |
| Immigrants | Liberia | 0.1 /100 | #275 | Tragic 5.7% |
| Somalis | 0.1 /100 | #276 | Tragic 5.7% |