Immigrants from Cabo Verde vs Canadian Per Capita Income
COMPARE
Immigrants from Cabo Verde
Canadian
Per Capita Income
Per Capita Income Comparison
Immigrants from Cabo Verde
Canadians
$38,540
PER CAPITA INCOME
0.3/ 100
METRIC RATING
272nd/ 347
METRIC RANK
$45,858
PER CAPITA INCOME
92.2/ 100
METRIC RATING
121st/ 347
METRIC RANK
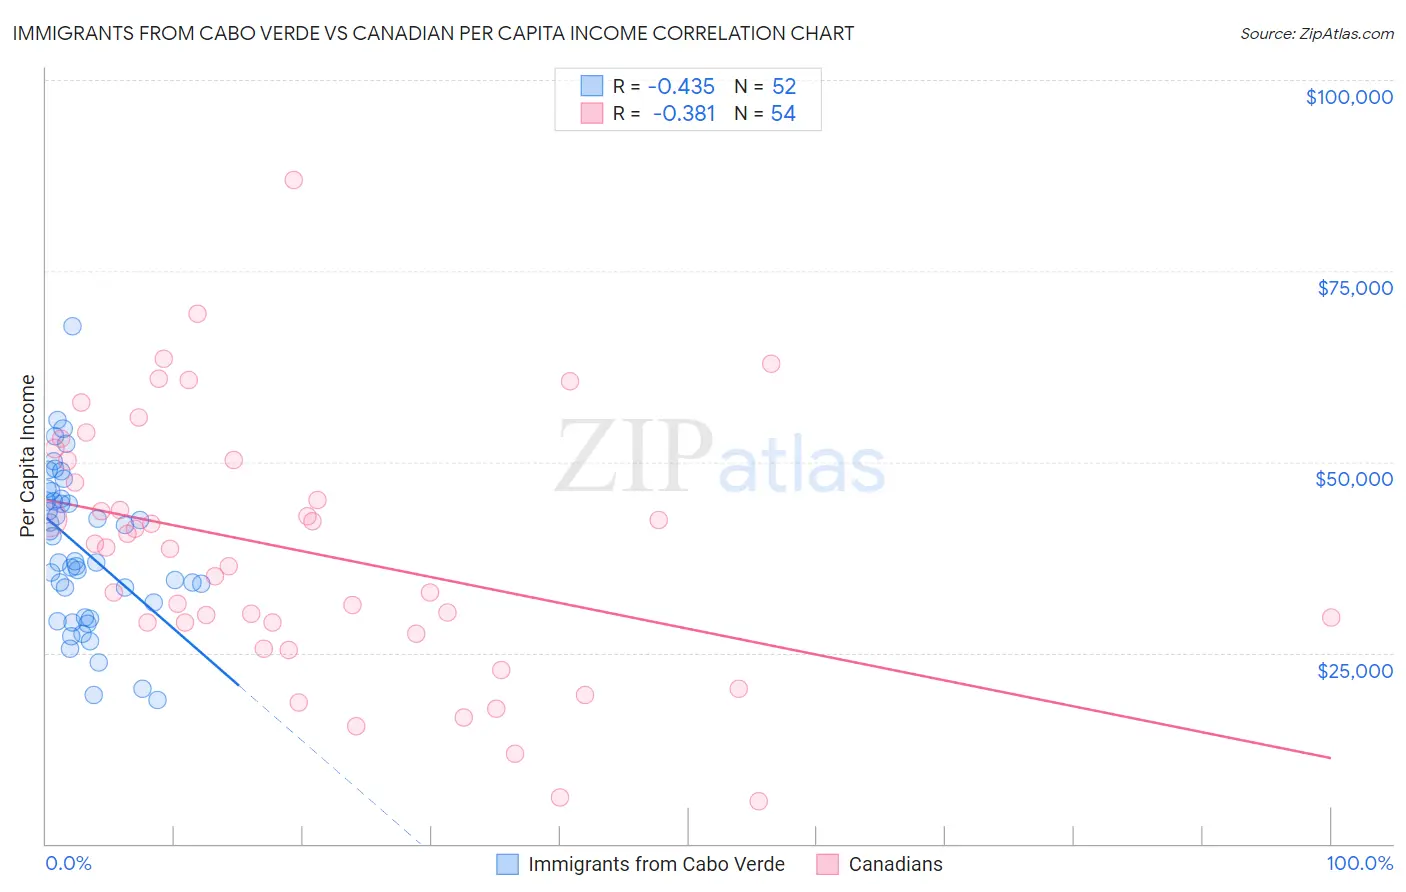
Immigrants from Cabo Verde vs Canadian Per Capita Income Correlation Chart
The statistical analysis conducted on geographies consisting of 38,153,224 people shows a moderate negative correlation between the proportion of Immigrants from Cabo Verde and per capita income in the United States with a correlation coefficient (R) of -0.435 and weighted average of $38,540. Similarly, the statistical analysis conducted on geographies consisting of 437,574,482 people shows a mild negative correlation between the proportion of Canadians and per capita income in the United States with a correlation coefficient (R) of -0.381 and weighted average of $45,858, a difference of 19.0%.
Per Capita Income Correlation Summary
| Measurement | Immigrants from Cabo Verde | Canadian |
| Minimum | $18,870 | $5,500 |
| Maximum | $67,818 | $86,868 |
| Range | $48,948 | $81,368 |
| Mean | $38,585 | $38,269 |
| Median | $36,913 | $38,676 |
| Interquartile 25% (IQ1) | $30,580 | $28,934 |
| Interquartile 75% (IQ3) | $45,064 | $50,164 |
| Interquartile Range (IQR) | $14,484 | $21,231 |
| Standard Deviation (Sample) | $10,185 | $16,643 |
| Standard Deviation (Population) | $10,087 | $16,488 |
Similar Demographics by Per Capita Income
Demographics Similar to Immigrants from Cabo Verde by Per Capita Income
In terms of per capita income, the demographic groups most similar to Immigrants from Cabo Verde are Central American ($38,560, a difference of 0.050%), Immigrants from Belize ($38,614, a difference of 0.19%), Nepalese ($38,442, a difference of 0.25%), Immigrants from El Salvador ($38,394, a difference of 0.38%), and Immigrants from Jamaica ($38,766, a difference of 0.59%).
| Demographics | Rating | Rank | Per Capita Income |
| Spanish Americans | 0.5 /100 | #265 | Tragic $39,012 |
| Salvadorans | 0.5 /100 | #266 | Tragic $38,858 |
| Immigrants | Zaire | 0.4 /100 | #267 | Tragic $38,848 |
| Liberians | 0.4 /100 | #268 | Tragic $38,780 |
| Immigrants | Jamaica | 0.4 /100 | #269 | Tragic $38,766 |
| Immigrants | Belize | 0.3 /100 | #270 | Tragic $38,614 |
| Central Americans | 0.3 /100 | #271 | Tragic $38,560 |
| Immigrants | Cabo Verde | 0.3 /100 | #272 | Tragic $38,540 |
| Nepalese | 0.3 /100 | #273 | Tragic $38,442 |
| Immigrants | El Salvador | 0.3 /100 | #274 | Tragic $38,394 |
| Immigrants | Liberia | 0.2 /100 | #275 | Tragic $38,165 |
| Hmong | 0.2 /100 | #276 | Tragic $38,120 |
| Comanche | 0.2 /100 | #277 | Tragic $38,088 |
| Immigrants | Nicaragua | 0.2 /100 | #278 | Tragic $38,065 |
| Colville | 0.2 /100 | #279 | Tragic $38,047 |
Demographics Similar to Canadians by Per Capita Income
In terms of per capita income, the demographic groups most similar to Canadians are Moroccan ($45,854, a difference of 0.010%), Lebanese ($45,840, a difference of 0.040%), European ($45,836, a difference of 0.050%), Zimbabwean ($45,804, a difference of 0.12%), and Immigrants from Ethiopia ($45,923, a difference of 0.14%).
| Demographics | Rating | Rank | Per Capita Income |
| Afghans | 94.9 /100 | #114 | Exceptional $46,268 |
| Immigrants | Chile | 94.6 /100 | #115 | Exceptional $46,213 |
| Poles | 94.1 /100 | #116 | Exceptional $46,123 |
| Chinese | 93.9 /100 | #117 | Exceptional $46,098 |
| Immigrants | Saudi Arabia | 93.3 /100 | #118 | Exceptional $46,008 |
| Immigrants | Poland | 93.1 /100 | #119 | Exceptional $45,979 |
| Immigrants | Ethiopia | 92.7 /100 | #120 | Exceptional $45,923 |
| Canadians | 92.2 /100 | #121 | Exceptional $45,858 |
| Moroccans | 92.1 /100 | #122 | Exceptional $45,854 |
| Lebanese | 92.0 /100 | #123 | Exceptional $45,840 |
| Europeans | 92.0 /100 | #124 | Exceptional $45,836 |
| Zimbabweans | 91.7 /100 | #125 | Exceptional $45,804 |
| Palestinians | 91.6 /100 | #126 | Exceptional $45,790 |
| Immigrants | Germany | 91.3 /100 | #127 | Exceptional $45,751 |
| Swedes | 91.3 /100 | #128 | Exceptional $45,750 |