Immigrants from Belarus vs Immigrants from Philippines Householder Income Ages 25 - 44 years
COMPARE
Immigrants from Belarus
Immigrants from Philippines
Householder Income Ages 25 - 44 years
Householder Income Ages 25 - 44 years Comparison
Immigrants from Belarus
Immigrants from Philippines
$107,393
HOUSEHOLDER INCOME AGES 25 - 44 YEARS
99.9/ 100
METRIC RATING
46th/ 347
METRIC RANK
$102,910
HOUSEHOLDER INCOME AGES 25 - 44 YEARS
99.0/ 100
METRIC RATING
84th/ 347
METRIC RANK
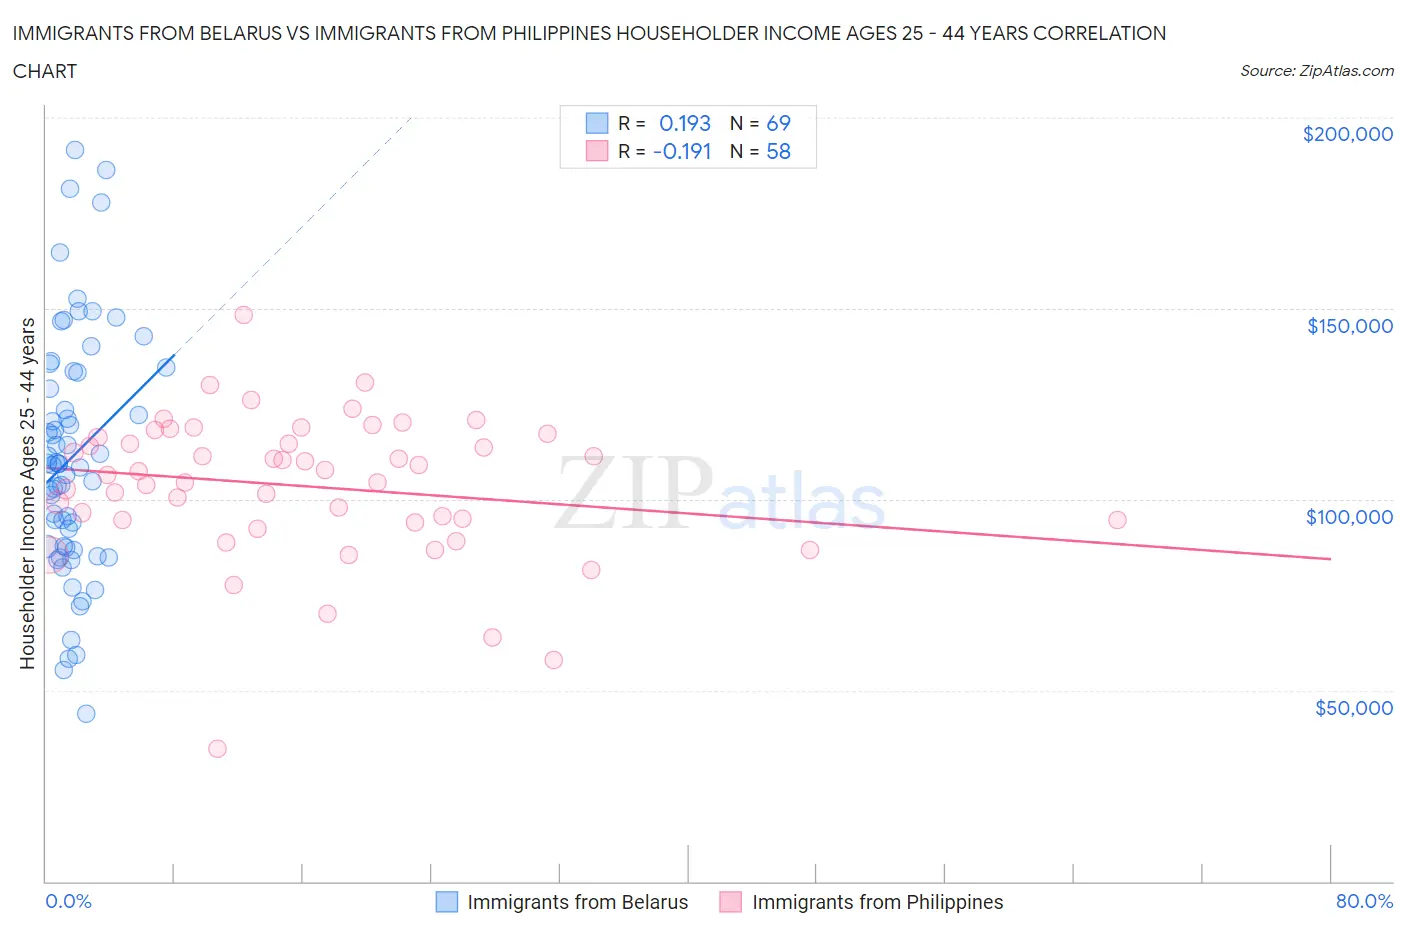
Immigrants from Belarus vs Immigrants from Philippines Householder Income Ages 25 - 44 years Correlation Chart
The statistical analysis conducted on geographies consisting of 150,157,706 people shows a poor positive correlation between the proportion of Immigrants from Belarus and household income with householder between the ages 25 and 44 in the United States with a correlation coefficient (R) of 0.193 and weighted average of $107,393. Similarly, the statistical analysis conducted on geographies consisting of 469,744,138 people shows a poor negative correlation between the proportion of Immigrants from Philippines and household income with householder between the ages 25 and 44 in the United States with a correlation coefficient (R) of -0.191 and weighted average of $102,910, a difference of 4.4%.
Householder Income Ages 25 - 44 years Correlation Summary
| Measurement | Immigrants from Belarus | Immigrants from Philippines |
| Minimum | $43,724 | $34,643 |
| Maximum | $191,528 | $148,401 |
| Range | $147,804 | $113,758 |
| Mean | $111,122 | $103,402 |
| Median | $109,354 | $106,816 |
| Interquartile 25% (IQ1) | $87,522 | $94,583 |
| Interquartile 75% (IQ3) | $133,299 | $116,347 |
| Interquartile Range (IQR) | $45,777 | $21,764 |
| Standard Deviation (Sample) | $31,608 | $19,015 |
| Standard Deviation (Population) | $31,378 | $18,850 |
Similar Demographics by Householder Income Ages 25 - 44 years
Demographics Similar to Immigrants from Belarus by Householder Income Ages 25 - 44 years
In terms of householder income ages 25 - 44 years, the demographic groups most similar to Immigrants from Belarus are Estonian ($107,269, a difference of 0.12%), Bulgarian ($107,264, a difference of 0.12%), Immigrants from Turkey ($107,258, a difference of 0.13%), Israeli ($107,579, a difference of 0.17%), and Immigrants from Indonesia ($107,627, a difference of 0.22%).
| Demographics | Rating | Rank | Householder Income Ages 25 - 44 years |
| Immigrants | France | 99.9 /100 | #39 | Exceptional $108,257 |
| Immigrants | Lithuania | 99.9 /100 | #40 | Exceptional $108,149 |
| Immigrants | Bolivia | 99.9 /100 | #41 | Exceptional $108,128 |
| Australians | 99.9 /100 | #42 | Exceptional $107,912 |
| Immigrants | Malaysia | 99.9 /100 | #43 | Exceptional $107,650 |
| Immigrants | Indonesia | 99.9 /100 | #44 | Exceptional $107,627 |
| Israelis | 99.9 /100 | #45 | Exceptional $107,579 |
| Immigrants | Belarus | 99.9 /100 | #46 | Exceptional $107,393 |
| Estonians | 99.9 /100 | #47 | Exceptional $107,269 |
| Bulgarians | 99.9 /100 | #48 | Exceptional $107,264 |
| Immigrants | Turkey | 99.9 /100 | #49 | Exceptional $107,258 |
| Cambodians | 99.9 /100 | #50 | Exceptional $107,148 |
| Immigrants | Czechoslovakia | 99.9 /100 | #51 | Exceptional $106,888 |
| Immigrants | Europe | 99.9 /100 | #52 | Exceptional $106,817 |
| Immigrants | Norway | 99.9 /100 | #53 | Exceptional $106,629 |
Demographics Similar to Immigrants from Philippines by Householder Income Ages 25 - 44 years
In terms of householder income ages 25 - 44 years, the demographic groups most similar to Immigrants from Philippines are Argentinean ($103,111, a difference of 0.20%), South African ($103,160, a difference of 0.24%), Immigrants from Serbia ($103,155, a difference of 0.24%), Immigrants from Ukraine ($102,664, a difference of 0.24%), and Immigrants from Hungary ($102,655, a difference of 0.25%).
| Demographics | Rating | Rank | Householder Income Ages 25 - 44 years |
| Immigrants | Southern Europe | 99.3 /100 | #77 | Exceptional $103,486 |
| Immigrants | Bulgaria | 99.3 /100 | #78 | Exceptional $103,423 |
| Armenians | 99.2 /100 | #79 | Exceptional $103,248 |
| Immigrants | Egypt | 99.2 /100 | #80 | Exceptional $103,192 |
| South Africans | 99.2 /100 | #81 | Exceptional $103,160 |
| Immigrants | Serbia | 99.2 /100 | #82 | Exceptional $103,155 |
| Argentineans | 99.1 /100 | #83 | Exceptional $103,111 |
| Immigrants | Philippines | 99.0 /100 | #84 | Exceptional $102,910 |
| Immigrants | Ukraine | 98.9 /100 | #85 | Exceptional $102,664 |
| Immigrants | Hungary | 98.9 /100 | #86 | Exceptional $102,655 |
| Immigrants | Western Europe | 98.9 /100 | #87 | Exceptional $102,654 |
| Immigrants | Canada | 98.9 /100 | #88 | Exceptional $102,616 |
| Romanians | 98.8 /100 | #89 | Exceptional $102,544 |
| Ukrainians | 98.8 /100 | #90 | Exceptional $102,451 |
| Croatians | 98.7 /100 | #91 | Exceptional $102,414 |