Immigrants from Burma/Myanmar vs Carpatho Rusyn In Labor Force | Age 30-34
COMPARE
Immigrants from Burma/Myanmar
Carpatho Rusyn
In Labor Force | Age 30-34
In Labor Force | Age 30-34 Comparison
Immigrants from Burma/Myanmar
Carpatho Rusyns
84.7%
IN LABOR FORCE | AGE 30-34
52.0/ 100
METRIC RATING
170th/ 347
METRIC RANK
86.2%
IN LABOR FORCE | AGE 30-34
100.0/ 100
METRIC RATING
11th/ 347
METRIC RANK
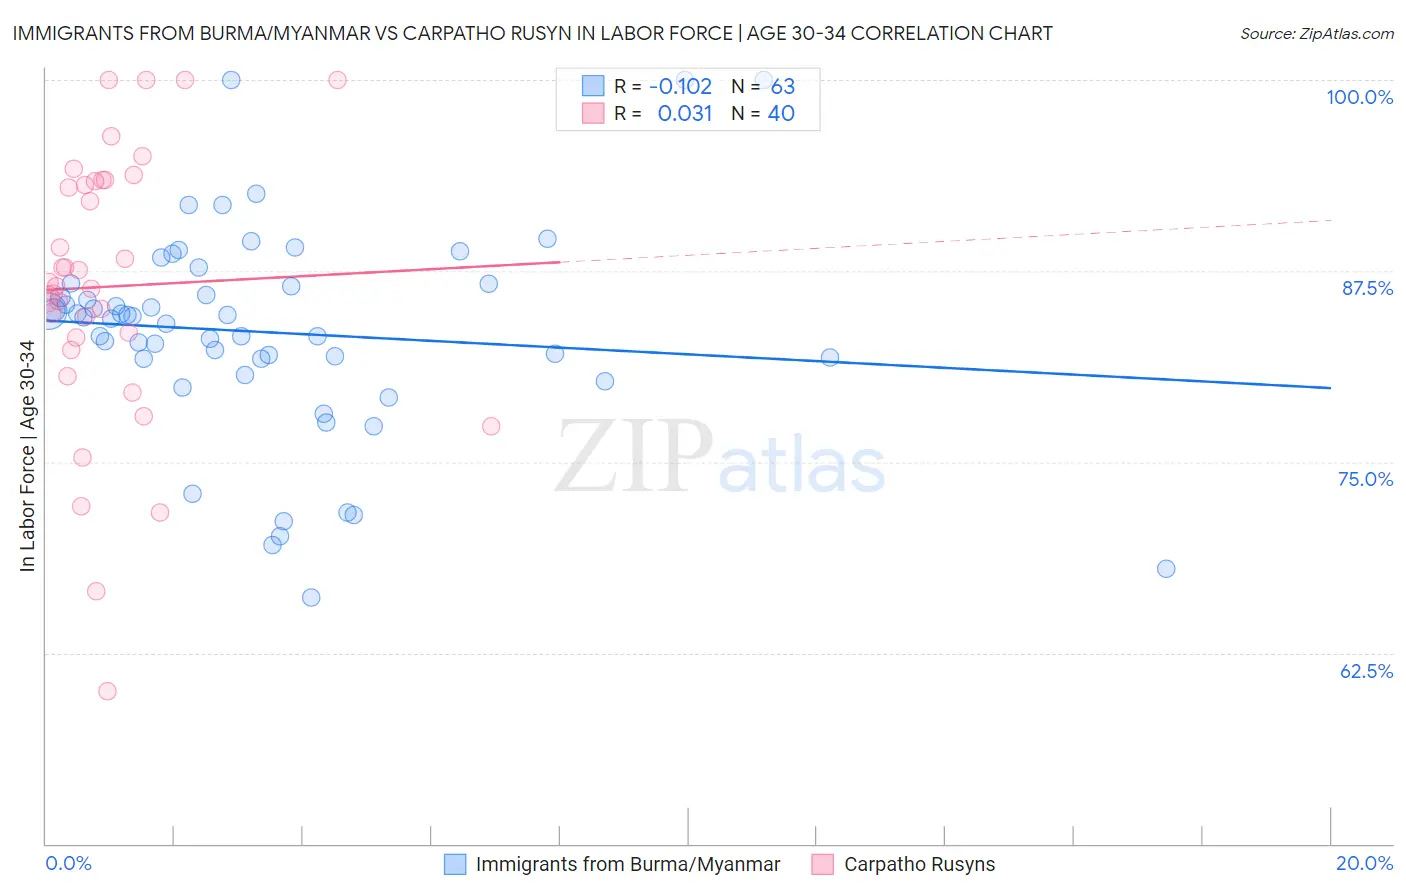
Immigrants from Burma/Myanmar vs Carpatho Rusyn In Labor Force | Age 30-34 Correlation Chart
The statistical analysis conducted on geographies consisting of 172,303,659 people shows a poor negative correlation between the proportion of Immigrants from Burma/Myanmar and labor force participation rate among population between the ages 30 and 34 in the United States with a correlation coefficient (R) of -0.102 and weighted average of 84.7%. Similarly, the statistical analysis conducted on geographies consisting of 58,871,401 people shows no correlation between the proportion of Carpatho Rusyns and labor force participation rate among population between the ages 30 and 34 in the United States with a correlation coefficient (R) of 0.031 and weighted average of 86.2%, a difference of 1.7%.
In Labor Force | Age 30-34 Correlation Summary
| Measurement | Immigrants from Burma/Myanmar | Carpatho Rusyn |
| Minimum | 66.1% | 60.0% |
| Maximum | 100.0% | 100.0% |
| Range | 33.9% | 40.0% |
| Mean | 83.5% | 86.5% |
| Median | 84.4% | 86.6% |
| Interquartile 25% (IQ1) | 81.8% | 82.7% |
| Interquartile 75% (IQ3) | 86.7% | 93.4% |
| Interquartile Range (IQR) | 4.9% | 10.7% |
| Standard Deviation (Sample) | 6.9% | 9.1% |
| Standard Deviation (Population) | 6.9% | 9.0% |
Similar Demographics by In Labor Force | Age 30-34
Demographics Similar to Immigrants from Burma/Myanmar by In Labor Force | Age 30-34
In terms of in labor force | age 30-34, the demographic groups most similar to Immigrants from Burma/Myanmar are Immigrants from Peru (84.7%, a difference of 0.0%), South American Indian (84.7%, a difference of 0.0%), Irish (84.7%, a difference of 0.0%), Immigrants from England (84.7%, a difference of 0.0%), and Israeli (84.7%, a difference of 0.010%).
| Demographics | Rating | Rank | In Labor Force | Age 30-34 |
| Immigrants | Uruguay | 57.4 /100 | #163 | Average 84.7% |
| Icelanders | 56.8 /100 | #164 | Average 84.7% |
| Immigrants | Western Europe | 56.7 /100 | #165 | Average 84.7% |
| Afghans | 55.2 /100 | #166 | Average 84.7% |
| Immigrants | South Eastern Asia | 54.2 /100 | #167 | Average 84.7% |
| Immigrants | Peru | 52.4 /100 | #168 | Average 84.7% |
| South American Indians | 52.1 /100 | #169 | Average 84.7% |
| Immigrants | Burma/Myanmar | 52.0 /100 | #170 | Average 84.7% |
| Irish | 52.0 /100 | #171 | Average 84.7% |
| Immigrants | England | 51.7 /100 | #172 | Average 84.7% |
| Israelis | 51.1 /100 | #173 | Average 84.7% |
| Finns | 50.0 /100 | #174 | Average 84.7% |
| Immigrants | South America | 50.0 /100 | #175 | Average 84.7% |
| Immigrants | Uzbekistan | 49.1 /100 | #176 | Average 84.7% |
| Laotians | 46.9 /100 | #177 | Average 84.7% |
Demographics Similar to Carpatho Rusyns by In Labor Force | Age 30-34
In terms of in labor force | age 30-34, the demographic groups most similar to Carpatho Rusyns are Immigrants from Serbia (86.2%, a difference of 0.010%), Immigrants from Somalia (86.2%, a difference of 0.040%), Cambodian (86.2%, a difference of 0.060%), Immigrants from Bolivia (86.2%, a difference of 0.070%), and Somali (86.2%, a difference of 0.080%).
| Demographics | Rating | Rank | In Labor Force | Age 30-34 |
| Liberians | 100.0 /100 | #4 | Exceptional 86.4% |
| Immigrants | Ireland | 100.0 /100 | #5 | Exceptional 86.3% |
| Somalis | 100.0 /100 | #6 | Exceptional 86.2% |
| Immigrants | Bolivia | 100.0 /100 | #7 | Exceptional 86.2% |
| Cambodians | 100.0 /100 | #8 | Exceptional 86.2% |
| Immigrants | Somalia | 100.0 /100 | #9 | Exceptional 86.2% |
| Immigrants | Serbia | 100.0 /100 | #10 | Exceptional 86.2% |
| Carpatho Rusyns | 100.0 /100 | #11 | Exceptional 86.2% |
| Bolivians | 100.0 /100 | #12 | Exceptional 86.1% |
| Immigrants | Croatia | 100.0 /100 | #13 | Exceptional 86.1% |
| Immigrants | Cabo Verde | 100.0 /100 | #14 | Exceptional 86.1% |
| Immigrants | Albania | 100.0 /100 | #15 | Exceptional 86.1% |
| Latvians | 100.0 /100 | #16 | Exceptional 86.0% |
| Immigrants | Cameroon | 100.0 /100 | #17 | Exceptional 86.0% |
| Immigrants | Sierra Leone | 100.0 /100 | #18 | Exceptional 86.0% |