Immigrants from Burma/Myanmar vs Carpatho Rusyn Unemployment Among Ages 16 to 19 years
COMPARE
Immigrants from Burma/Myanmar
Carpatho Rusyn
Unemployment Among Ages 16 to 19 years
Unemployment Among Ages 16 to 19 years Comparison
Immigrants from Burma/Myanmar
Carpatho Rusyns
15.6%
UNEMPLOYMENT AMONG AGES 16 TO 19 YEARS
100.0/ 100
METRIC RATING
13th/ 347
METRIC RANK
17.9%
UNEMPLOYMENT AMONG AGES 16 TO 19 YEARS
15.6/ 100
METRIC RATING
210th/ 347
METRIC RANK
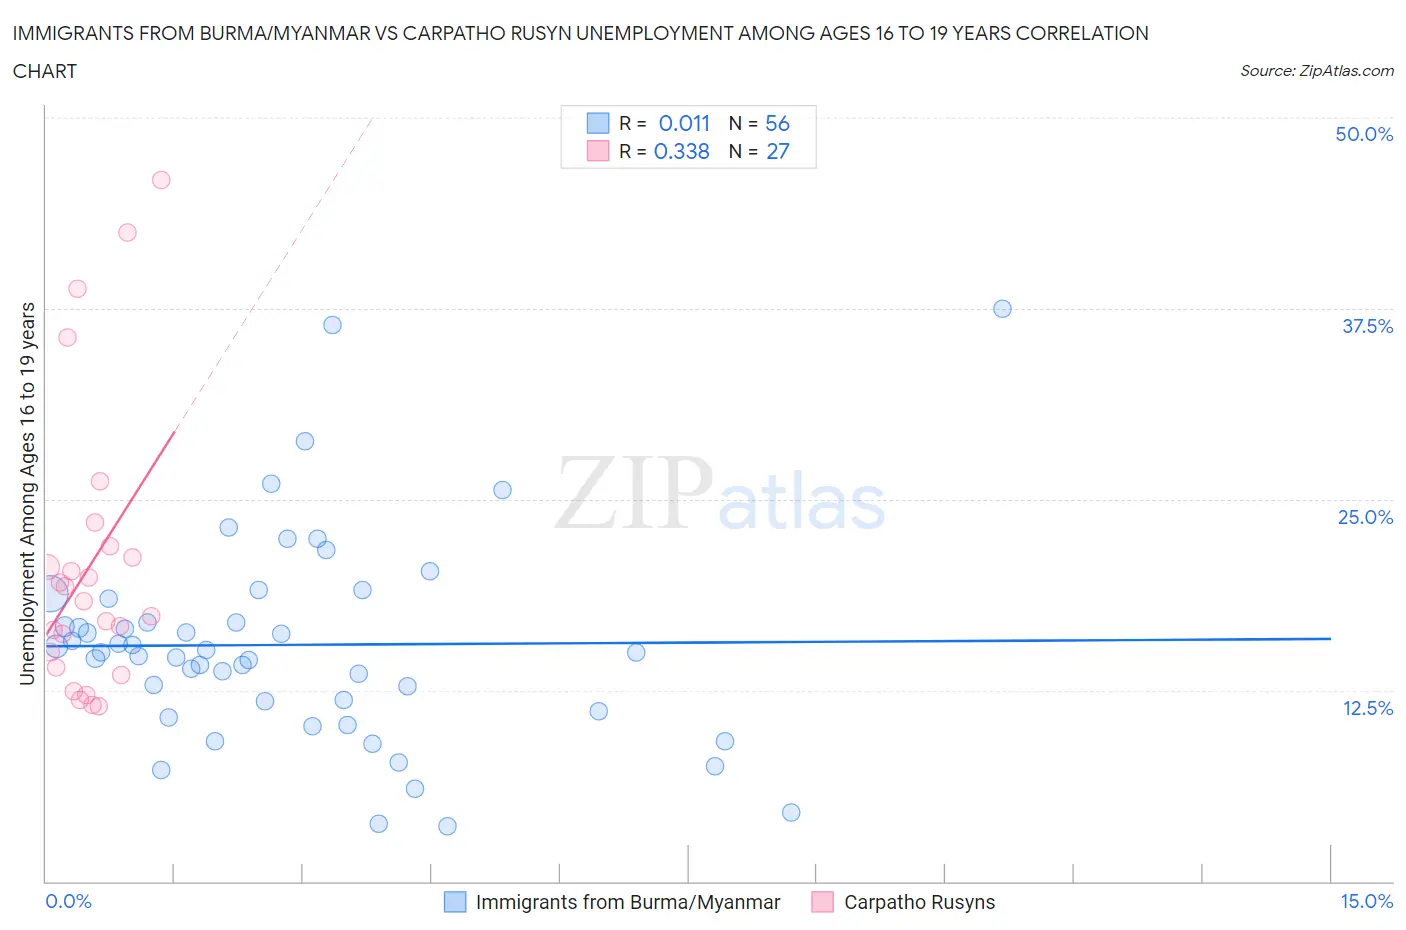
Immigrants from Burma/Myanmar vs Carpatho Rusyn Unemployment Among Ages 16 to 19 years Correlation Chart
The statistical analysis conducted on geographies consisting of 168,780,503 people shows no correlation between the proportion of Immigrants from Burma/Myanmar and unemployment rate among population between the ages 16 and 19 in the United States with a correlation coefficient (R) of 0.011 and weighted average of 15.6%. Similarly, the statistical analysis conducted on geographies consisting of 57,767,385 people shows a mild positive correlation between the proportion of Carpatho Rusyns and unemployment rate among population between the ages 16 and 19 in the United States with a correlation coefficient (R) of 0.338 and weighted average of 17.9%, a difference of 14.9%.
Unemployment Among Ages 16 to 19 years Correlation Summary
| Measurement | Immigrants from Burma/Myanmar | Carpatho Rusyn |
| Minimum | 3.6% | 11.5% |
| Maximum | 37.5% | 45.9% |
| Range | 33.9% | 34.4% |
| Mean | 15.5% | 20.7% |
| Median | 15.0% | 18.3% |
| Interquartile 25% (IQ1) | 11.5% | 14.0% |
| Interquartile 75% (IQ3) | 17.7% | 21.9% |
| Interquartile Range (IQR) | 6.3% | 7.9% |
| Standard Deviation (Sample) | 6.8% | 9.4% |
| Standard Deviation (Population) | 6.7% | 9.2% |
Similar Demographics by Unemployment Among Ages 16 to 19 years
Demographics Similar to Immigrants from Burma/Myanmar by Unemployment Among Ages 16 to 19 years
In terms of unemployment among ages 16 to 19 years, the demographic groups most similar to Immigrants from Burma/Myanmar are Immigrants from Zaire (15.6%, a difference of 0.14%), Yugoslavian (15.6%, a difference of 0.20%), Taiwanese (15.5%, a difference of 0.43%), German (15.7%, a difference of 0.49%), and Indonesian (15.5%, a difference of 0.53%).
| Demographics | Rating | Rank | Unemployment Among Ages 16 to 19 years |
| Swedes | 100.0 /100 | #6 | Exceptional 15.3% |
| Immigrants | Bosnia and Herzegovina | 100.0 /100 | #7 | Exceptional 15.3% |
| Czechs | 100.0 /100 | #8 | Exceptional 15.4% |
| Scandinavians | 100.0 /100 | #9 | Exceptional 15.4% |
| Zimbabweans | 100.0 /100 | #10 | Exceptional 15.4% |
| Indonesians | 100.0 /100 | #11 | Exceptional 15.5% |
| Taiwanese | 100.0 /100 | #12 | Exceptional 15.5% |
| Immigrants | Burma/Myanmar | 100.0 /100 | #13 | Exceptional 15.6% |
| Immigrants | Zaire | 100.0 /100 | #14 | Exceptional 15.6% |
| Yugoslavians | 100.0 /100 | #15 | Exceptional 15.6% |
| Germans | 100.0 /100 | #16 | Exceptional 15.7% |
| Somalis | 100.0 /100 | #17 | Exceptional 15.7% |
| Thais | 100.0 /100 | #18 | Exceptional 15.7% |
| Swiss | 100.0 /100 | #19 | Exceptional 15.8% |
| Sudanese | 100.0 /100 | #20 | Exceptional 15.8% |
Demographics Similar to Carpatho Rusyns by Unemployment Among Ages 16 to 19 years
In terms of unemployment among ages 16 to 19 years, the demographic groups most similar to Carpatho Rusyns are Cherokee (17.9%, a difference of 0.010%), Hawaiian (17.9%, a difference of 0.10%), Guamanian/Chamorro (17.9%, a difference of 0.10%), Argentinean (18.0%, a difference of 0.16%), and Chippewa (18.0%, a difference of 0.17%).
| Demographics | Rating | Rank | Unemployment Among Ages 16 to 19 years |
| Immigrants | Eastern Europe | 23.6 /100 | #203 | Fair 17.8% |
| Immigrants | Nonimmigrants | 20.9 /100 | #204 | Fair 17.9% |
| Assyrians/Chaldeans/Syriacs | 20.8 /100 | #205 | Fair 17.9% |
| Immigrants | Southern Europe | 18.9 /100 | #206 | Poor 17.9% |
| Liberians | 18.6 /100 | #207 | Poor 17.9% |
| Hawaiians | 16.8 /100 | #208 | Poor 17.9% |
| Cherokee | 15.7 /100 | #209 | Poor 17.9% |
| Carpatho Rusyns | 15.6 /100 | #210 | Poor 17.9% |
| Guamanians/Chamorros | 14.5 /100 | #211 | Poor 17.9% |
| Argentineans | 13.8 /100 | #212 | Poor 18.0% |
| Chippewa | 13.7 /100 | #213 | Poor 18.0% |
| Immigrants | Morocco | 13.5 /100 | #214 | Poor 18.0% |
| Immigrants | Syria | 13.3 /100 | #215 | Poor 18.0% |
| Immigrants | Kazakhstan | 13.0 /100 | #216 | Poor 18.0% |
| South American Indians | 13.0 /100 | #217 | Poor 18.0% |