Immigrants from Kenya vs Aleut Householder Income Ages 45 - 64 years
COMPARE
Immigrants from Kenya
Aleut
Householder Income Ages 45 - 64 years
Householder Income Ages 45 - 64 years Comparison
Immigrants from Kenya
Aleuts
$97,964
HOUSEHOLDER INCOME AGES 45 - 64 YEARS
23.5/ 100
METRIC RATING
200th/ 347
METRIC RANK
$100,052
HOUSEHOLDER INCOME AGES 45 - 64 YEARS
46.6/ 100
METRIC RATING
180th/ 347
METRIC RANK
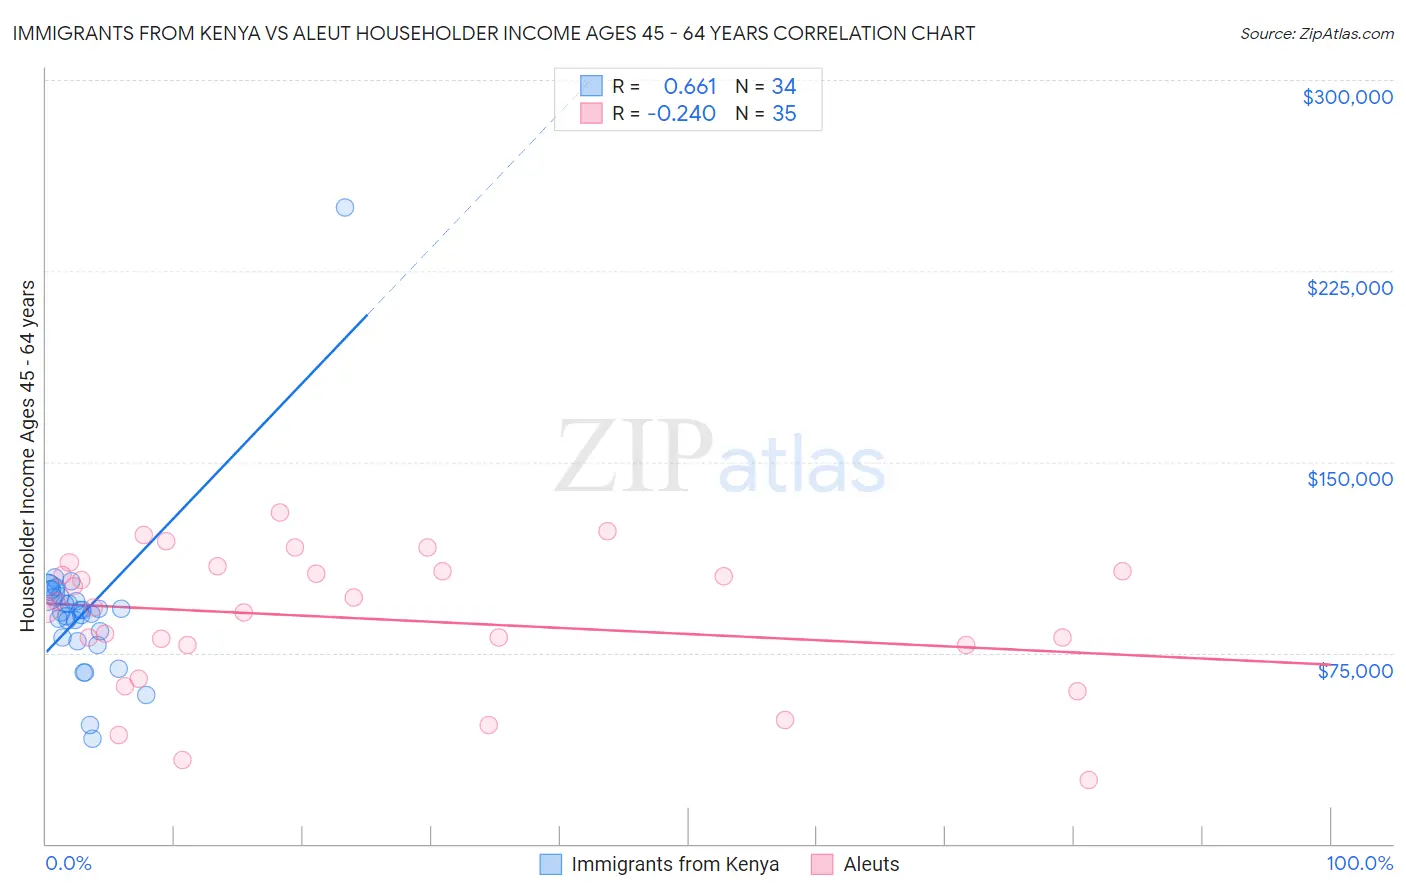
Immigrants from Kenya vs Aleut Householder Income Ages 45 - 64 years Correlation Chart
The statistical analysis conducted on geographies consisting of 217,894,820 people shows a significant positive correlation between the proportion of Immigrants from Kenya and household income with householder between the ages 45 and 64 in the United States with a correlation coefficient (R) of 0.661 and weighted average of $97,964. Similarly, the statistical analysis conducted on geographies consisting of 61,745,960 people shows a weak negative correlation between the proportion of Aleuts and household income with householder between the ages 45 and 64 in the United States with a correlation coefficient (R) of -0.240 and weighted average of $100,052, a difference of 2.1%.
Householder Income Ages 45 - 64 years Correlation Summary
| Measurement | Immigrants from Kenya | Aleut |
| Minimum | $41,343 | $25,250 |
| Maximum | $250,001 | $130,063 |
| Range | $208,658 | $104,813 |
| Mean | $91,195 | $88,376 |
| Median | $91,314 | $92,906 |
| Interquartile 25% (IQ1) | $80,833 | $78,125 |
| Interquartile 75% (IQ3) | $97,063 | $107,188 |
| Interquartile Range (IQR) | $16,231 | $29,063 |
| Standard Deviation (Sample) | $31,961 | $26,902 |
| Standard Deviation (Population) | $31,487 | $26,515 |
Demographics Similar to Immigrants from Kenya and Aleuts by Householder Income Ages 45 - 64 years
In terms of householder income ages 45 - 64 years, the demographic groups most similar to Immigrants from Kenya are White/Caucasian ($98,091, a difference of 0.13%), Immigrants from Iraq ($98,201, a difference of 0.24%), Puget Sound Salish ($98,340, a difference of 0.38%), Immigrants from Eastern Africa ($98,467, a difference of 0.51%), and Spanish ($98,554, a difference of 0.60%). Similarly, the demographic groups most similar to Aleuts are Immigrants ($99,943, a difference of 0.11%), Finnish ($99,904, a difference of 0.15%), Spaniard ($99,889, a difference of 0.16%), French ($99,824, a difference of 0.23%), and Colombian ($99,772, a difference of 0.28%).
| Demographics | Rating | Rank | Householder Income Ages 45 - 64 years |
| Aleuts | 46.6 /100 | #180 | Average $100,052 |
| Immigrants | Immigrants | 45.3 /100 | #181 | Average $99,943 |
| Finns | 44.8 /100 | #182 | Average $99,904 |
| Spaniards | 44.6 /100 | #183 | Average $99,889 |
| French | 43.8 /100 | #184 | Average $99,824 |
| Colombians | 43.2 /100 | #185 | Average $99,772 |
| Dutch | 41.7 /100 | #186 | Average $99,650 |
| Iraqis | 38.5 /100 | #187 | Fair $99,387 |
| Immigrants | Portugal | 36.3 /100 | #188 | Fair $99,203 |
| Immigrants | South America | 35.4 /100 | #189 | Fair $99,126 |
| French Canadians | 35.1 /100 | #190 | Fair $99,093 |
| Kenyans | 33.7 /100 | #191 | Fair $98,970 |
| Celtics | 32.9 /100 | #192 | Fair $98,896 |
| Hawaiians | 31.6 /100 | #193 | Fair $98,778 |
| Uruguayans | 30.3 /100 | #194 | Fair $98,660 |
| Spanish | 29.2 /100 | #195 | Fair $98,554 |
| Immigrants | Eastern Africa | 28.3 /100 | #196 | Fair $98,467 |
| Puget Sound Salish | 27.0 /100 | #197 | Fair $98,340 |
| Immigrants | Iraq | 25.7 /100 | #198 | Fair $98,201 |
| Whites/Caucasians | 24.6 /100 | #199 | Fair $98,091 |
| Immigrants | Kenya | 23.5 /100 | #200 | Fair $97,964 |