Hopi vs Aleut Householder Income Ages 45 - 64 years
COMPARE
Hopi
Aleut
Householder Income Ages 45 - 64 years
Householder Income Ages 45 - 64 years Comparison
Hopi
Aleuts
$75,562
HOUSEHOLDER INCOME AGES 45 - 64 YEARS
0.0/ 100
METRIC RATING
338th/ 347
METRIC RANK
$100,052
HOUSEHOLDER INCOME AGES 45 - 64 YEARS
46.6/ 100
METRIC RATING
180th/ 347
METRIC RANK
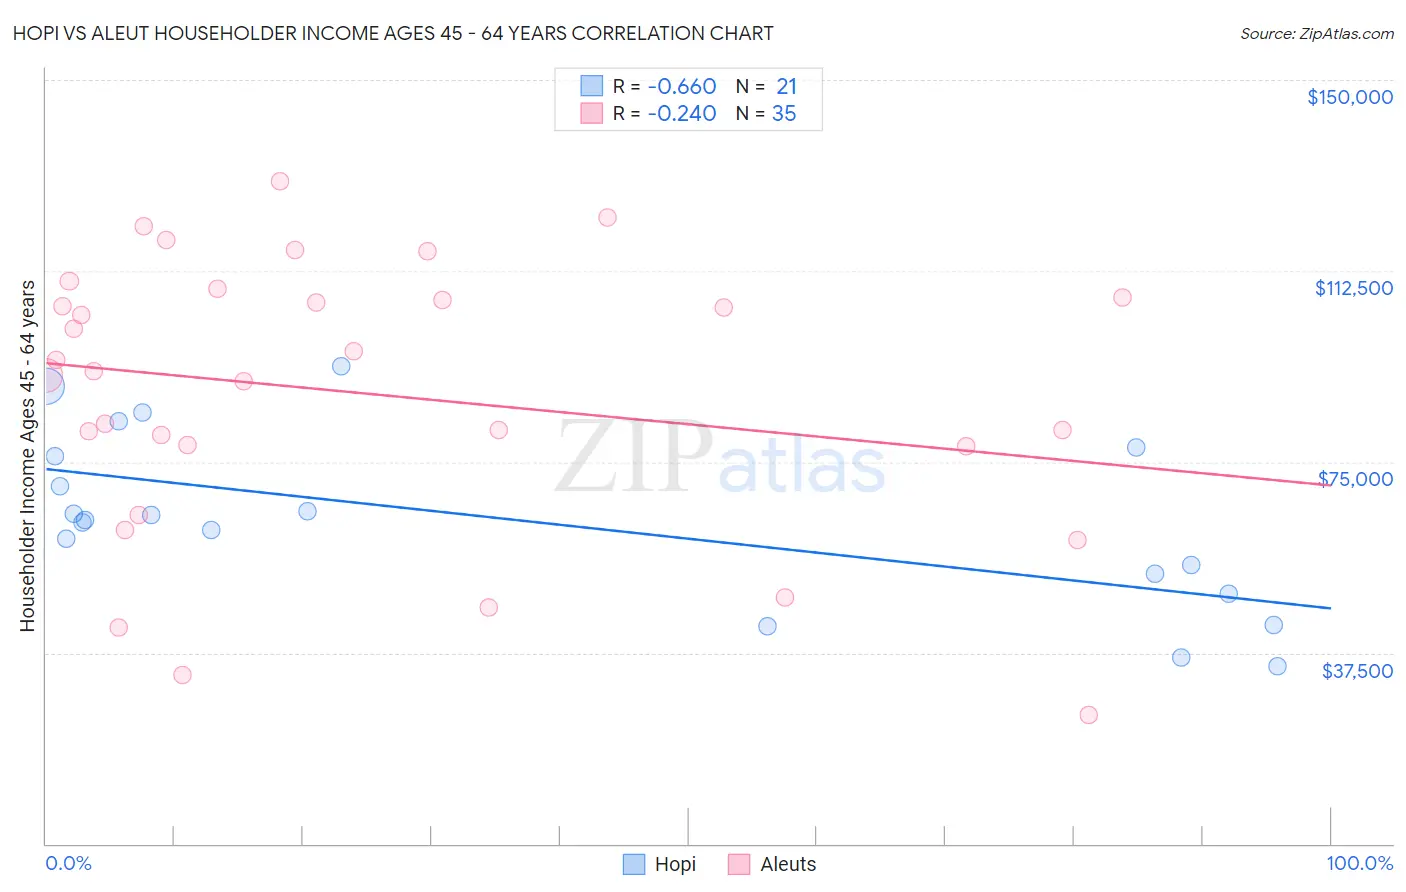
Hopi vs Aleut Householder Income Ages 45 - 64 years Correlation Chart
The statistical analysis conducted on geographies consisting of 74,685,429 people shows a significant negative correlation between the proportion of Hopi and household income with householder between the ages 45 and 64 in the United States with a correlation coefficient (R) of -0.660 and weighted average of $75,562. Similarly, the statistical analysis conducted on geographies consisting of 61,745,960 people shows a weak negative correlation between the proportion of Aleuts and household income with householder between the ages 45 and 64 in the United States with a correlation coefficient (R) of -0.240 and weighted average of $100,052, a difference of 32.4%.
Householder Income Ages 45 - 64 years Correlation Summary
| Measurement | Hopi | Aleut |
| Minimum | $34,950 | $25,250 |
| Maximum | $93,766 | $130,063 |
| Range | $58,816 | $104,813 |
| Mean | $63,454 | $88,376 |
| Median | $63,663 | $92,906 |
| Interquartile 25% (IQ1) | $51,066 | $78,125 |
| Interquartile 75% (IQ3) | $76,979 | $107,188 |
| Interquartile Range (IQR) | $25,913 | $29,063 |
| Standard Deviation (Sample) | $16,805 | $26,902 |
| Standard Deviation (Population) | $16,400 | $26,515 |
Similar Demographics by Householder Income Ages 45 - 64 years
Demographics Similar to Hopi by Householder Income Ages 45 - 64 years
In terms of householder income ages 45 - 64 years, the demographic groups most similar to Hopi are Pueblo ($75,601, a difference of 0.050%), Arapaho ($75,945, a difference of 0.51%), Kiowa ($74,815, a difference of 1.0%), Cheyenne ($76,362, a difference of 1.1%), and Immigrants from Yemen ($74,575, a difference of 1.3%).
| Demographics | Rating | Rank | Householder Income Ages 45 - 64 years |
| Immigrants | Dominican Republic | 0.0 /100 | #331 | Tragic $78,836 |
| Blacks/African Americans | 0.0 /100 | #332 | Tragic $78,556 |
| Immigrants | Congo | 0.0 /100 | #333 | Tragic $77,850 |
| Menominee | 0.0 /100 | #334 | Tragic $76,903 |
| Cheyenne | 0.0 /100 | #335 | Tragic $76,362 |
| Arapaho | 0.0 /100 | #336 | Tragic $75,945 |
| Pueblo | 0.0 /100 | #337 | Tragic $75,601 |
| Hopi | 0.0 /100 | #338 | Tragic $75,562 |
| Kiowa | 0.0 /100 | #339 | Tragic $74,815 |
| Immigrants | Yemen | 0.0 /100 | #340 | Tragic $74,575 |
| Crow | 0.0 /100 | #341 | Tragic $74,257 |
| Tohono O'odham | 0.0 /100 | #342 | Tragic $73,774 |
| Pima | 0.0 /100 | #343 | Tragic $73,365 |
| Houma | 0.0 /100 | #344 | Tragic $72,093 |
| Navajo | 0.0 /100 | #345 | Tragic $69,759 |
Demographics Similar to Aleuts by Householder Income Ages 45 - 64 years
In terms of householder income ages 45 - 64 years, the demographic groups most similar to Aleuts are Belgian ($100,060, a difference of 0.010%), Immigrants from Cameroon ($100,084, a difference of 0.030%), Immigrants from Costa Rica ($100,141, a difference of 0.090%), Moroccan ($100,138, a difference of 0.090%), and Immigrants ($99,943, a difference of 0.11%).
| Demographics | Rating | Rank | Householder Income Ages 45 - 64 years |
| Alsatians | 51.4 /100 | #173 | Average $100,435 |
| Welsh | 50.0 /100 | #174 | Average $100,322 |
| Germans | 48.8 /100 | #175 | Average $100,224 |
| Immigrants | Costa Rica | 47.7 /100 | #176 | Average $100,141 |
| Moroccans | 47.7 /100 | #177 | Average $100,138 |
| Immigrants | Cameroon | 47.0 /100 | #178 | Average $100,084 |
| Belgians | 46.7 /100 | #179 | Average $100,060 |
| Aleuts | 46.6 /100 | #180 | Average $100,052 |
| Immigrants | Immigrants | 45.3 /100 | #181 | Average $99,943 |
| Finns | 44.8 /100 | #182 | Average $99,904 |
| Spaniards | 44.6 /100 | #183 | Average $99,889 |
| French | 43.8 /100 | #184 | Average $99,824 |
| Colombians | 43.2 /100 | #185 | Average $99,772 |
| Dutch | 41.7 /100 | #186 | Average $99,650 |
| Iraqis | 38.5 /100 | #187 | Fair $99,387 |