Immigrants from Bulgaria vs Belizean Wage/Income Gap
COMPARE
Immigrants from Bulgaria
Belizean
Wage/Income Gap
Wage/Income Gap Comparison
Immigrants from Bulgaria
Belizeans
26.3%
WAGE/INCOME GAP
22.5/ 100
METRIC RATING
192nd/ 347
METRIC RANK
21.2%
WAGE/INCOME GAP
100.0/ 100
METRIC RATING
36th/ 347
METRIC RANK
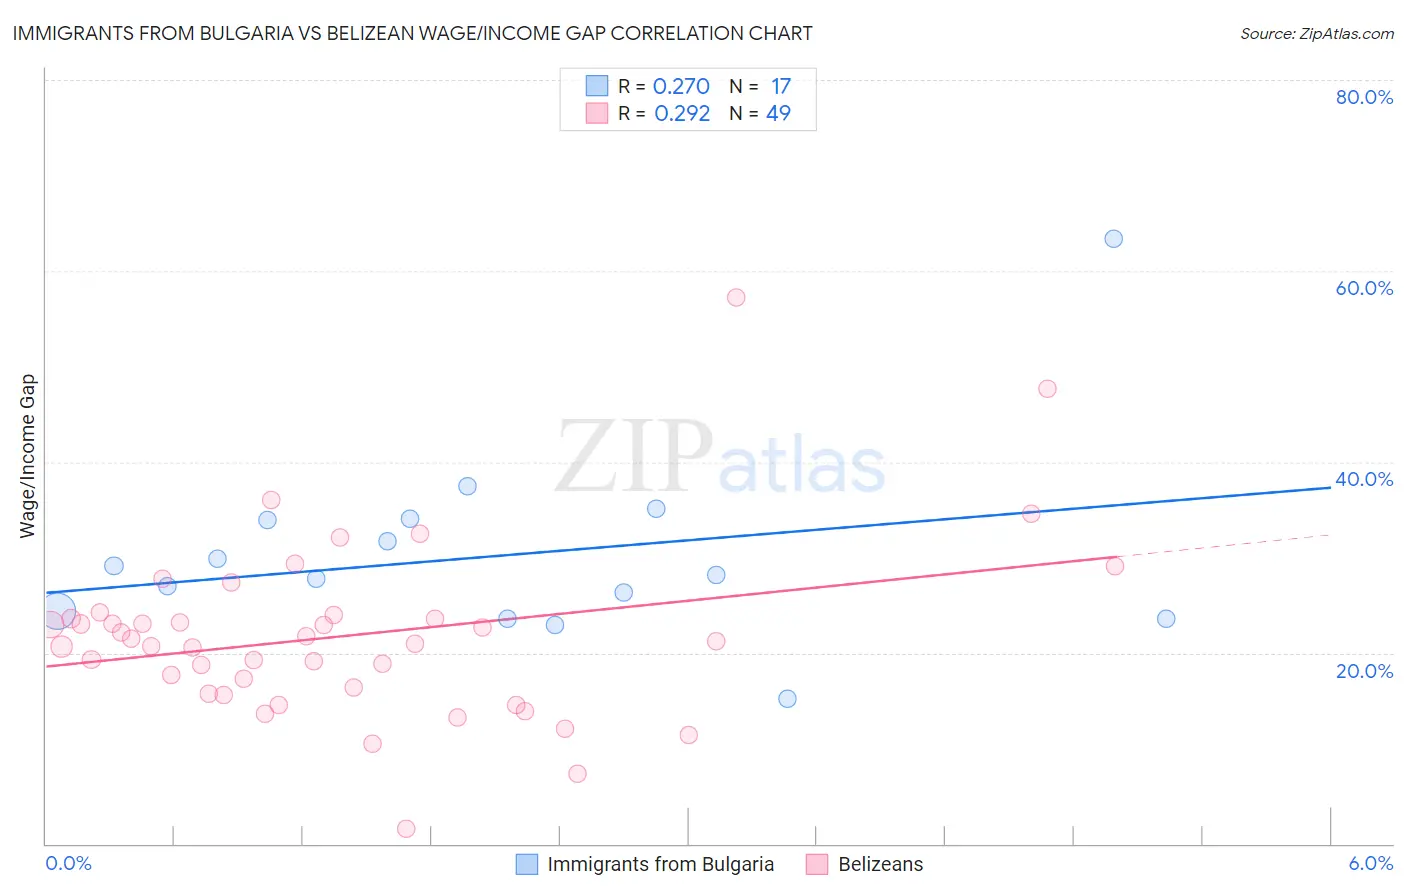
Immigrants from Bulgaria vs Belizean Wage/Income Gap Correlation Chart
The statistical analysis conducted on geographies consisting of 172,517,670 people shows a weak positive correlation between the proportion of Immigrants from Bulgaria and wage/income gap percentage in the United States with a correlation coefficient (R) of 0.270 and weighted average of 26.3%. Similarly, the statistical analysis conducted on geographies consisting of 144,188,181 people shows a weak positive correlation between the proportion of Belizeans and wage/income gap percentage in the United States with a correlation coefficient (R) of 0.292 and weighted average of 21.2%, a difference of 23.8%.
Wage/Income Gap Correlation Summary
| Measurement | Immigrants from Bulgaria | Belizean |
| Minimum | 15.1% | 1.6% |
| Maximum | 63.4% | 57.2% |
| Range | 48.3% | 55.6% |
| Mean | 30.2% | 21.8% |
| Median | 28.2% | 21.3% |
| Interquartile 25% (IQ1) | 24.0% | 16.1% |
| Interquartile 75% (IQ3) | 34.0% | 23.8% |
| Interquartile Range (IQR) | 10.0% | 7.7% |
| Standard Deviation (Sample) | 10.2% | 9.3% |
| Standard Deviation (Population) | 9.8% | 9.2% |
Similar Demographics by Wage/Income Gap
Demographics Similar to Immigrants from Bulgaria by Wage/Income Gap
In terms of wage/income gap, the demographic groups most similar to Immigrants from Bulgaria are Immigrants from Jordan (26.3%, a difference of 0.020%), Chilean (26.3%, a difference of 0.020%), Immigrants from Malaysia (26.3%, a difference of 0.030%), Immigrants from Western Asia (26.3%, a difference of 0.080%), and Zimbabwean (26.3%, a difference of 0.090%).
| Demographics | Rating | Rank | Wage/Income Gap |
| Pakistanis | 33.7 /100 | #185 | Fair 26.1% |
| Immigrants | Indonesia | 32.5 /100 | #186 | Fair 26.1% |
| Palestinians | 29.9 /100 | #187 | Fair 26.1% |
| Immigrants | Egypt | 29.9 /100 | #188 | Fair 26.1% |
| Immigrants | Moldova | 26.6 /100 | #189 | Fair 26.2% |
| Immigrants | Croatia | 24.8 /100 | #190 | Fair 26.2% |
| Immigrants | Venezuela | 24.7 /100 | #191 | Fair 26.2% |
| Immigrants | Bulgaria | 22.5 /100 | #192 | Fair 26.3% |
| Immigrants | Jordan | 22.4 /100 | #193 | Fair 26.3% |
| Chileans | 22.3 /100 | #194 | Fair 26.3% |
| Immigrants | Malaysia | 22.2 /100 | #195 | Fair 26.3% |
| Immigrants | Western Asia | 21.7 /100 | #196 | Fair 26.3% |
| Zimbabweans | 21.6 /100 | #197 | Fair 26.3% |
| Venezuelans | 21.5 /100 | #198 | Fair 26.3% |
| Dutch West Indians | 21.0 /100 | #199 | Fair 26.3% |
Demographics Similar to Belizeans by Wage/Income Gap
In terms of wage/income gap, the demographic groups most similar to Belizeans are Somali (21.2%, a difference of 0.020%), Immigrants from Somalia (21.2%, a difference of 0.070%), Immigrants from Belize (21.3%, a difference of 0.12%), Colville (21.3%, a difference of 0.23%), and Lumbee (21.3%, a difference of 0.43%).
| Demographics | Rating | Rank | Wage/Income Gap |
| Immigrants | Senegal | 100.0 /100 | #29 | Exceptional 20.9% |
| Immigrants | Bangladesh | 100.0 /100 | #30 | Exceptional 20.9% |
| Vietnamese | 100.0 /100 | #31 | Exceptional 21.0% |
| Immigrants | Yemen | 100.0 /100 | #32 | Exceptional 21.1% |
| Immigrants | Bahamas | 100.0 /100 | #33 | Exceptional 21.1% |
| Pima | 100.0 /100 | #34 | Exceptional 21.1% |
| Somalis | 100.0 /100 | #35 | Exceptional 21.2% |
| Belizeans | 100.0 /100 | #36 | Exceptional 21.2% |
| Immigrants | Somalia | 100.0 /100 | #37 | Exceptional 21.2% |
| Immigrants | Belize | 100.0 /100 | #38 | Exceptional 21.3% |
| Colville | 100.0 /100 | #39 | Exceptional 21.3% |
| Lumbee | 100.0 /100 | #40 | Exceptional 21.3% |
| Liberians | 100.0 /100 | #41 | Exceptional 21.4% |
| Immigrants | Sierra Leone | 100.0 /100 | #42 | Exceptional 21.4% |
| Sierra Leoneans | 100.0 /100 | #43 | Exceptional 21.4% |