Immigrants from Brazil vs Immigrants from Ukraine Householder Income Ages 25 - 44 years
COMPARE
Immigrants from Brazil
Immigrants from Ukraine
Householder Income Ages 25 - 44 years
Householder Income Ages 25 - 44 years Comparison
Immigrants from Brazil
Immigrants from Ukraine
$100,534
HOUSEHOLDER INCOME AGES 25 - 44 YEARS
96.5/ 100
METRIC RATING
106th/ 347
METRIC RANK
$102,664
HOUSEHOLDER INCOME AGES 25 - 44 YEARS
98.9/ 100
METRIC RATING
85th/ 347
METRIC RANK
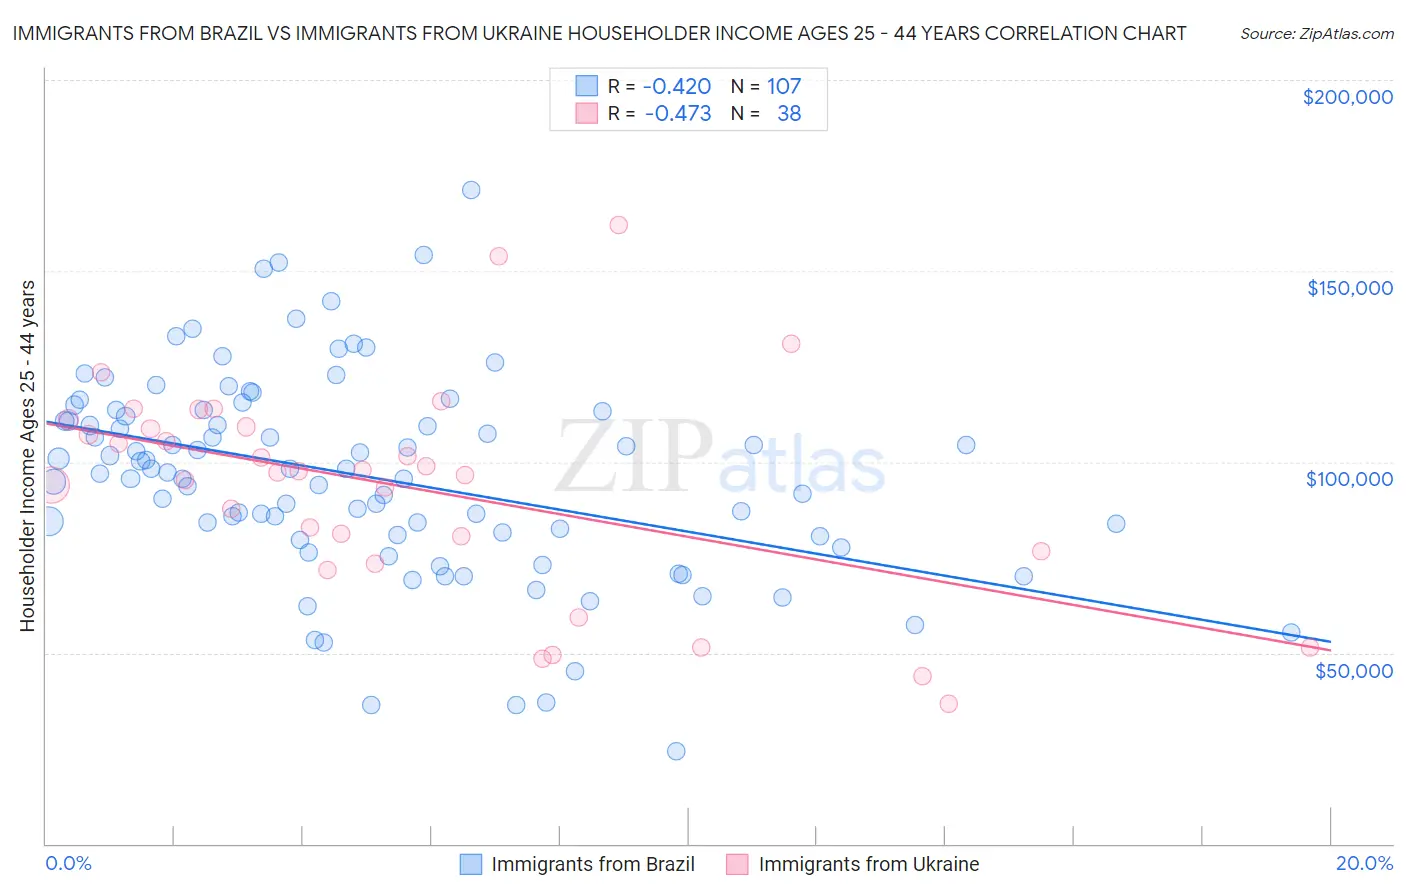
Immigrants from Brazil vs Immigrants from Ukraine Householder Income Ages 25 - 44 years Correlation Chart
The statistical analysis conducted on geographies consisting of 342,484,702 people shows a moderate negative correlation between the proportion of Immigrants from Brazil and household income with householder between the ages 25 and 44 in the United States with a correlation coefficient (R) of -0.420 and weighted average of $100,534. Similarly, the statistical analysis conducted on geographies consisting of 289,246,712 people shows a moderate negative correlation between the proportion of Immigrants from Ukraine and household income with householder between the ages 25 and 44 in the United States with a correlation coefficient (R) of -0.473 and weighted average of $102,664, a difference of 2.1%.
Householder Income Ages 25 - 44 years Correlation Summary
| Measurement | Immigrants from Brazil | Immigrants from Ukraine |
| Minimum | $24,240 | $36,667 |
| Maximum | $171,042 | $161,875 |
| Range | $146,802 | $125,208 |
| Mean | $95,965 | $93,208 |
| Median | $97,321 | $97,296 |
| Interquartile 25% (IQ1) | $80,473 | $76,718 |
| Interquartile 75% (IQ3) | $113,214 | $109,168 |
| Interquartile Range (IQR) | $32,741 | $32,451 |
| Standard Deviation (Sample) | $26,677 | $28,398 |
| Standard Deviation (Population) | $26,552 | $28,022 |
Similar Demographics by Householder Income Ages 25 - 44 years
Demographics Similar to Immigrants from Brazil by Householder Income Ages 25 - 44 years
In terms of householder income ages 25 - 44 years, the demographic groups most similar to Immigrants from Brazil are Immigrants from Vietnam ($100,535, a difference of 0.0%), Northern European ($100,457, a difference of 0.080%), Immigrants from South Eastern Asia ($100,283, a difference of 0.25%), Immigrants from North Macedonia ($100,101, a difference of 0.43%), and Immigrants from Poland ($101,065, a difference of 0.53%).
| Demographics | Rating | Rank | Householder Income Ages 25 - 44 years |
| Taiwanese | 97.9 /100 | #99 | Exceptional $101,492 |
| Immigrants | Argentina | 97.8 /100 | #100 | Exceptional $101,415 |
| Albanians | 97.8 /100 | #101 | Exceptional $101,367 |
| Immigrants | Lebanon | 97.4 /100 | #102 | Exceptional $101,124 |
| Immigrants | Moldova | 97.4 /100 | #103 | Exceptional $101,091 |
| Immigrants | Poland | 97.4 /100 | #104 | Exceptional $101,065 |
| Immigrants | Vietnam | 96.5 /100 | #105 | Exceptional $100,535 |
| Immigrants | Brazil | 96.5 /100 | #106 | Exceptional $100,534 |
| Northern Europeans | 96.3 /100 | #107 | Exceptional $100,457 |
| Immigrants | South Eastern Asia | 96.0 /100 | #108 | Exceptional $100,283 |
| Immigrants | North Macedonia | 95.6 /100 | #109 | Exceptional $100,101 |
| Immigrants | Afghanistan | 95.3 /100 | #110 | Exceptional $99,977 |
| Chileans | 95.1 /100 | #111 | Exceptional $99,900 |
| Poles | 94.5 /100 | #112 | Exceptional $99,685 |
| Tongans | 94.2 /100 | #113 | Exceptional $99,604 |
Demographics Similar to Immigrants from Ukraine by Householder Income Ages 25 - 44 years
In terms of householder income ages 25 - 44 years, the demographic groups most similar to Immigrants from Ukraine are Immigrants from Hungary ($102,655, a difference of 0.010%), Immigrants from Western Europe ($102,654, a difference of 0.010%), Immigrants from Canada ($102,616, a difference of 0.050%), Romanian ($102,544, a difference of 0.12%), and Ukrainian ($102,451, a difference of 0.21%).
| Demographics | Rating | Rank | Householder Income Ages 25 - 44 years |
| Immigrants | Bulgaria | 99.3 /100 | #78 | Exceptional $103,423 |
| Armenians | 99.2 /100 | #79 | Exceptional $103,248 |
| Immigrants | Egypt | 99.2 /100 | #80 | Exceptional $103,192 |
| South Africans | 99.2 /100 | #81 | Exceptional $103,160 |
| Immigrants | Serbia | 99.2 /100 | #82 | Exceptional $103,155 |
| Argentineans | 99.1 /100 | #83 | Exceptional $103,111 |
| Immigrants | Philippines | 99.0 /100 | #84 | Exceptional $102,910 |
| Immigrants | Ukraine | 98.9 /100 | #85 | Exceptional $102,664 |
| Immigrants | Hungary | 98.9 /100 | #86 | Exceptional $102,655 |
| Immigrants | Western Europe | 98.9 /100 | #87 | Exceptional $102,654 |
| Immigrants | Canada | 98.9 /100 | #88 | Exceptional $102,616 |
| Romanians | 98.8 /100 | #89 | Exceptional $102,544 |
| Ukrainians | 98.8 /100 | #90 | Exceptional $102,451 |
| Croatians | 98.7 /100 | #91 | Exceptional $102,414 |
| Immigrants | North America | 98.7 /100 | #92 | Exceptional $102,407 |