Immigrants from Brazil vs Iraqi Householder Income Ages 25 - 44 years
COMPARE
Immigrants from Brazil
Iraqi
Householder Income Ages 25 - 44 years
Householder Income Ages 25 - 44 years Comparison
Immigrants from Brazil
Iraqis
$100,534
HOUSEHOLDER INCOME AGES 25 - 44 YEARS
96.5/ 100
METRIC RATING
106th/ 347
METRIC RANK
$90,764
HOUSEHOLDER INCOME AGES 25 - 44 YEARS
10.8/ 100
METRIC RATING
211th/ 347
METRIC RANK
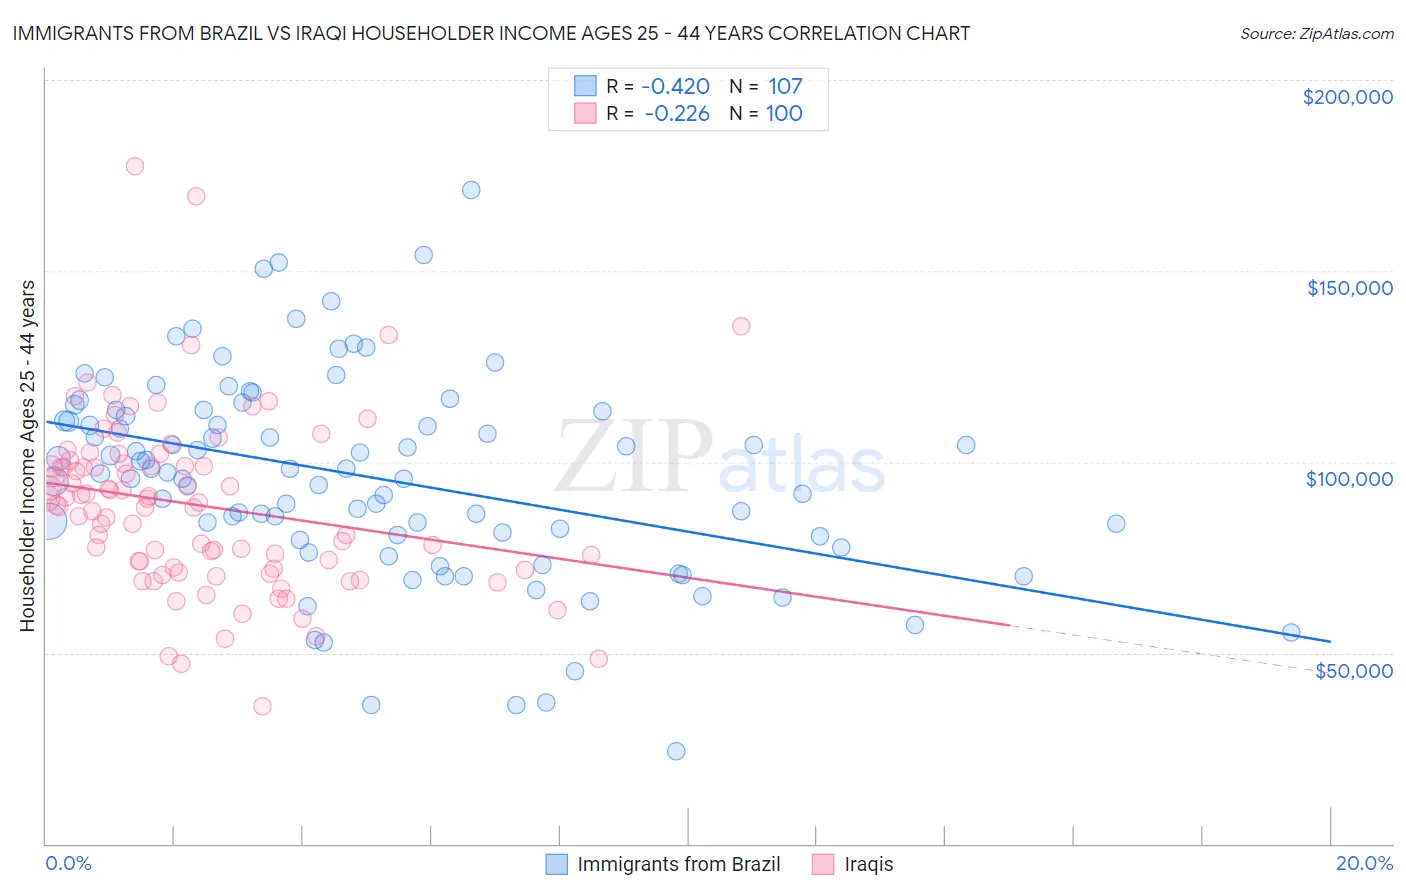
Immigrants from Brazil vs Iraqi Householder Income Ages 25 - 44 years Correlation Chart
The statistical analysis conducted on geographies consisting of 342,484,702 people shows a moderate negative correlation between the proportion of Immigrants from Brazil and household income with householder between the ages 25 and 44 in the United States with a correlation coefficient (R) of -0.420 and weighted average of $100,534. Similarly, the statistical analysis conducted on geographies consisting of 170,561,402 people shows a weak negative correlation between the proportion of Iraqis and household income with householder between the ages 25 and 44 in the United States with a correlation coefficient (R) of -0.226 and weighted average of $90,764, a difference of 10.8%.
Householder Income Ages 25 - 44 years Correlation Summary
| Measurement | Immigrants from Brazil | Iraqi |
| Minimum | $24,240 | $35,938 |
| Maximum | $171,042 | $177,567 |
| Range | $146,802 | $141,629 |
| Mean | $95,965 | $88,687 |
| Median | $97,321 | $88,906 |
| Interquartile 25% (IQ1) | $80,473 | $72,138 |
| Interquartile 75% (IQ3) | $113,214 | $99,186 |
| Interquartile Range (IQR) | $32,741 | $27,048 |
| Standard Deviation (Sample) | $26,677 | $23,025 |
| Standard Deviation (Population) | $26,552 | $22,910 |
Similar Demographics by Householder Income Ages 25 - 44 years
Demographics Similar to Immigrants from Brazil by Householder Income Ages 25 - 44 years
In terms of householder income ages 25 - 44 years, the demographic groups most similar to Immigrants from Brazil are Immigrants from Vietnam ($100,535, a difference of 0.0%), Northern European ($100,457, a difference of 0.080%), Immigrants from South Eastern Asia ($100,283, a difference of 0.25%), Immigrants from North Macedonia ($100,101, a difference of 0.43%), and Immigrants from Poland ($101,065, a difference of 0.53%).
| Demographics | Rating | Rank | Householder Income Ages 25 - 44 years |
| Taiwanese | 97.9 /100 | #99 | Exceptional $101,492 |
| Immigrants | Argentina | 97.8 /100 | #100 | Exceptional $101,415 |
| Albanians | 97.8 /100 | #101 | Exceptional $101,367 |
| Immigrants | Lebanon | 97.4 /100 | #102 | Exceptional $101,124 |
| Immigrants | Moldova | 97.4 /100 | #103 | Exceptional $101,091 |
| Immigrants | Poland | 97.4 /100 | #104 | Exceptional $101,065 |
| Immigrants | Vietnam | 96.5 /100 | #105 | Exceptional $100,535 |
| Immigrants | Brazil | 96.5 /100 | #106 | Exceptional $100,534 |
| Northern Europeans | 96.3 /100 | #107 | Exceptional $100,457 |
| Immigrants | South Eastern Asia | 96.0 /100 | #108 | Exceptional $100,283 |
| Immigrants | North Macedonia | 95.6 /100 | #109 | Exceptional $100,101 |
| Immigrants | Afghanistan | 95.3 /100 | #110 | Exceptional $99,977 |
| Chileans | 95.1 /100 | #111 | Exceptional $99,900 |
| Poles | 94.5 /100 | #112 | Exceptional $99,685 |
| Tongans | 94.2 /100 | #113 | Exceptional $99,604 |
Demographics Similar to Iraqis by Householder Income Ages 25 - 44 years
In terms of householder income ages 25 - 44 years, the demographic groups most similar to Iraqis are Immigrants from Kenya ($90,767, a difference of 0.0%), Hawaiian ($90,722, a difference of 0.050%), Immigrants from Bangladesh ($90,448, a difference of 0.35%), Immigrants from Africa ($90,372, a difference of 0.43%), and Immigrants from Uruguay ($91,171, a difference of 0.45%).
| Demographics | Rating | Rank | Householder Income Ages 25 - 44 years |
| Nepalese | 15.4 /100 | #204 | Poor $91,498 |
| Immigrants | Eastern Africa | 15.2 /100 | #205 | Poor $91,458 |
| Aleuts | 14.5 /100 | #206 | Poor $91,370 |
| Yugoslavians | 14.5 /100 | #207 | Poor $91,368 |
| Immigrants | Thailand | 14.3 /100 | #208 | Poor $91,337 |
| Immigrants | Uruguay | 13.2 /100 | #209 | Poor $91,171 |
| Immigrants | Kenya | 10.9 /100 | #210 | Poor $90,767 |
| Iraqis | 10.8 /100 | #211 | Poor $90,764 |
| Hawaiians | 10.6 /100 | #212 | Poor $90,722 |
| Immigrants | Bangladesh | 9.3 /100 | #213 | Tragic $90,448 |
| Immigrants | Africa | 8.9 /100 | #214 | Tragic $90,372 |
| Panamanians | 8.1 /100 | #215 | Tragic $90,193 |
| Ghanaians | 7.9 /100 | #216 | Tragic $90,137 |
| Scotch-Irish | 7.3 /100 | #217 | Tragic $89,969 |
| Guyanese | 7.1 /100 | #218 | Tragic $89,940 |