Lebanese vs Immigrants from Ecuador Householder Income Ages 25 - 44 years
COMPARE
Lebanese
Immigrants from Ecuador
Householder Income Ages 25 - 44 years
Householder Income Ages 25 - 44 years Comparison
Lebanese
Immigrants from Ecuador
$97,339
HOUSEHOLDER INCOME AGES 25 - 44 YEARS
82.3/ 100
METRIC RATING
137th/ 347
METRIC RANK
$89,673
HOUSEHOLDER INCOME AGES 25 - 44 YEARS
6.2/ 100
METRIC RATING
222nd/ 347
METRIC RANK
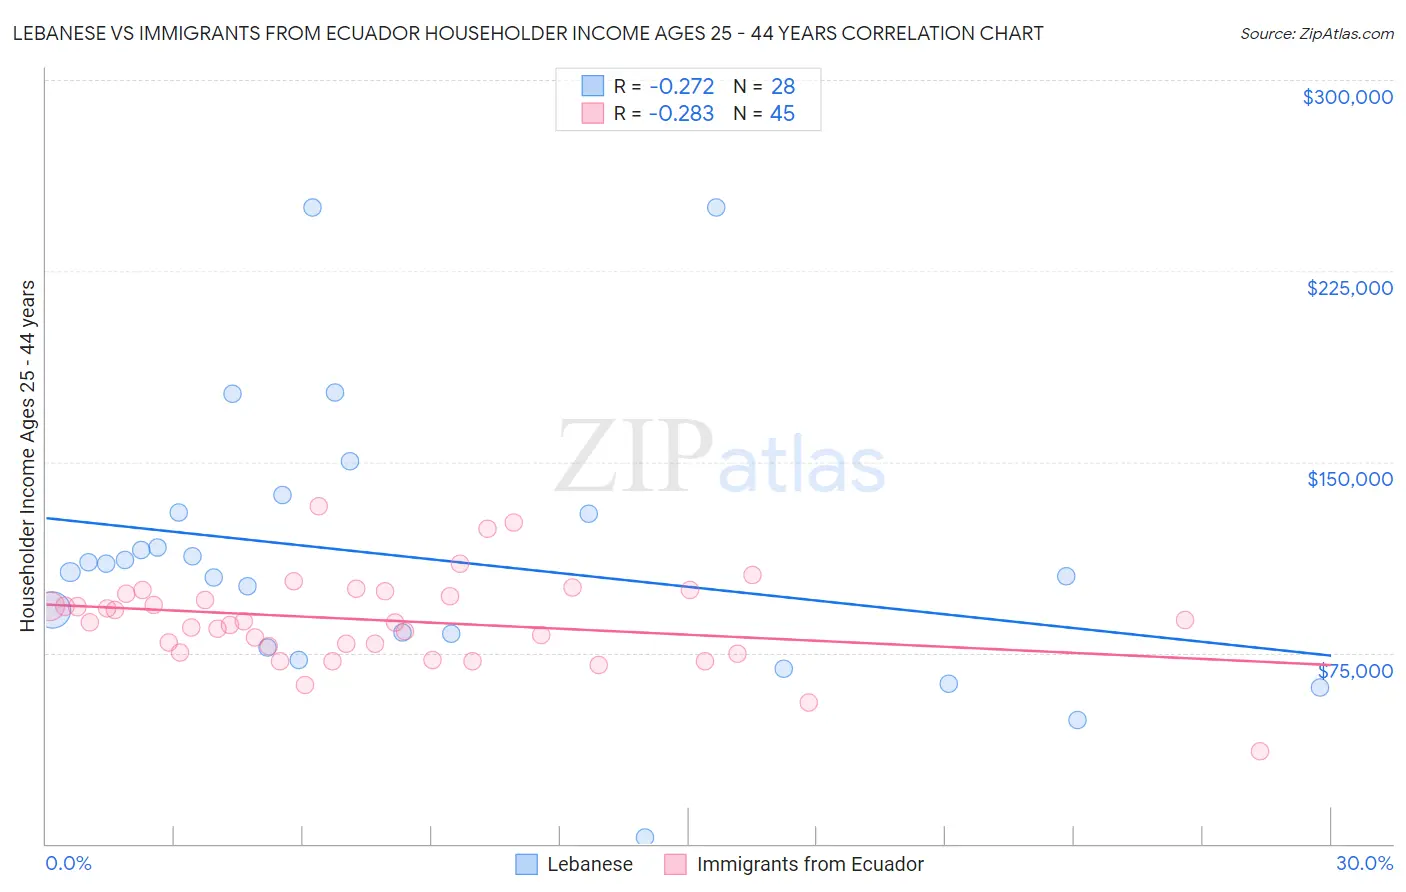
Lebanese vs Immigrants from Ecuador Householder Income Ages 25 - 44 years Correlation Chart
The statistical analysis conducted on geographies consisting of 400,475,460 people shows a weak negative correlation between the proportion of Lebanese and household income with householder between the ages 25 and 44 in the United States with a correlation coefficient (R) of -0.272 and weighted average of $97,339. Similarly, the statistical analysis conducted on geographies consisting of 270,658,714 people shows a weak negative correlation between the proportion of Immigrants from Ecuador and household income with householder between the ages 25 and 44 in the United States with a correlation coefficient (R) of -0.283 and weighted average of $89,673, a difference of 8.6%.
Householder Income Ages 25 - 44 years Correlation Summary
| Measurement | Lebanese | Immigrants from Ecuador |
| Minimum | $2,499 | $36,176 |
| Maximum | $250,001 | $132,426 |
| Range | $247,502 | $96,250 |
| Mean | $112,372 | $87,697 |
| Median | $108,314 | $87,101 |
| Interquartile 25% (IQ1) | $79,902 | $76,225 |
| Interquartile 75% (IQ3) | $129,887 | $98,630 |
| Interquartile Range (IQR) | $49,985 | $22,405 |
| Standard Deviation (Sample) | $53,521 | $17,650 |
| Standard Deviation (Population) | $52,557 | $17,453 |
Similar Demographics by Householder Income Ages 25 - 44 years
Demographics Similar to Lebanese by Householder Income Ages 25 - 44 years
In terms of householder income ages 25 - 44 years, the demographic groups most similar to Lebanese are Arab ($97,336, a difference of 0.0%), Immigrants from Peru ($97,329, a difference of 0.010%), Immigrants from Morocco ($97,305, a difference of 0.030%), Luxembourger ($97,237, a difference of 0.10%), and Danish ($97,221, a difference of 0.12%).
| Demographics | Rating | Rank | Householder Income Ages 25 - 44 years |
| Immigrants | Kuwait | 87.8 /100 | #130 | Excellent $98,122 |
| Immigrants | Albania | 86.6 /100 | #131 | Excellent $97,929 |
| Immigrants | Zimbabwe | 86.3 /100 | #132 | Excellent $97,880 |
| Tsimshian | 85.8 /100 | #133 | Excellent $97,809 |
| Canadians | 84.5 /100 | #134 | Excellent $97,625 |
| Immigrants | Oceania | 84.5 /100 | #135 | Excellent $97,623 |
| Hungarians | 83.9 /100 | #136 | Excellent $97,544 |
| Lebanese | 82.3 /100 | #137 | Excellent $97,339 |
| Arabs | 82.3 /100 | #138 | Excellent $97,336 |
| Immigrants | Peru | 82.2 /100 | #139 | Excellent $97,329 |
| Immigrants | Morocco | 82.0 /100 | #140 | Excellent $97,305 |
| Luxembourgers | 81.5 /100 | #141 | Excellent $97,237 |
| Danes | 81.3 /100 | #142 | Excellent $97,221 |
| Immigrants | Jordan | 81.0 /100 | #143 | Excellent $97,185 |
| Immigrants | Chile | 80.8 /100 | #144 | Excellent $97,159 |
Demographics Similar to Immigrants from Ecuador by Householder Income Ages 25 - 44 years
In terms of householder income ages 25 - 44 years, the demographic groups most similar to Immigrants from Ecuador are Immigrants from Trinidad and Tobago ($89,748, a difference of 0.080%), Immigrants from Guyana ($89,586, a difference of 0.10%), Barbadian ($89,565, a difference of 0.12%), Trinidadian and Tobagonian ($89,856, a difference of 0.20%), and Delaware ($89,876, a difference of 0.23%).
| Demographics | Rating | Rank | Householder Income Ages 25 - 44 years |
| Panamanians | 8.1 /100 | #215 | Tragic $90,193 |
| Ghanaians | 7.9 /100 | #216 | Tragic $90,137 |
| Scotch-Irish | 7.3 /100 | #217 | Tragic $89,969 |
| Guyanese | 7.1 /100 | #218 | Tragic $89,940 |
| Delaware | 6.9 /100 | #219 | Tragic $89,876 |
| Trinidadians and Tobagonians | 6.8 /100 | #220 | Tragic $89,856 |
| Immigrants | Trinidad and Tobago | 6.5 /100 | #221 | Tragic $89,748 |
| Immigrants | Ecuador | 6.2 /100 | #222 | Tragic $89,673 |
| Immigrants | Guyana | 5.9 /100 | #223 | Tragic $89,586 |
| Barbadians | 5.9 /100 | #224 | Tragic $89,565 |
| Immigrants | Panama | 5.5 /100 | #225 | Tragic $89,451 |
| Immigrants | Iraq | 5.5 /100 | #226 | Tragic $89,444 |
| Immigrants | St. Vincent and the Grenadines | 4.1 /100 | #227 | Tragic $88,888 |
| Immigrants | Bosnia and Herzegovina | 4.0 /100 | #228 | Tragic $88,819 |
| Immigrants | Barbados | 3.7 /100 | #229 | Tragic $88,687 |