Immigrants from Bosnia and Herzegovina vs Immigrants from Mexico Householder Income Ages 25 - 44 years
COMPARE
Immigrants from Bosnia and Herzegovina
Immigrants from Mexico
Householder Income Ages 25 - 44 years
Householder Income Ages 25 - 44 years Comparison
Immigrants from Bosnia and Herzegovina
Immigrants from Mexico
$88,819
HOUSEHOLDER INCOME AGES 25 - 44 YEARS
4.0/ 100
METRIC RATING
228th/ 347
METRIC RANK
$78,809
HOUSEHOLDER INCOME AGES 25 - 44 YEARS
0.0/ 100
METRIC RATING
318th/ 347
METRIC RANK
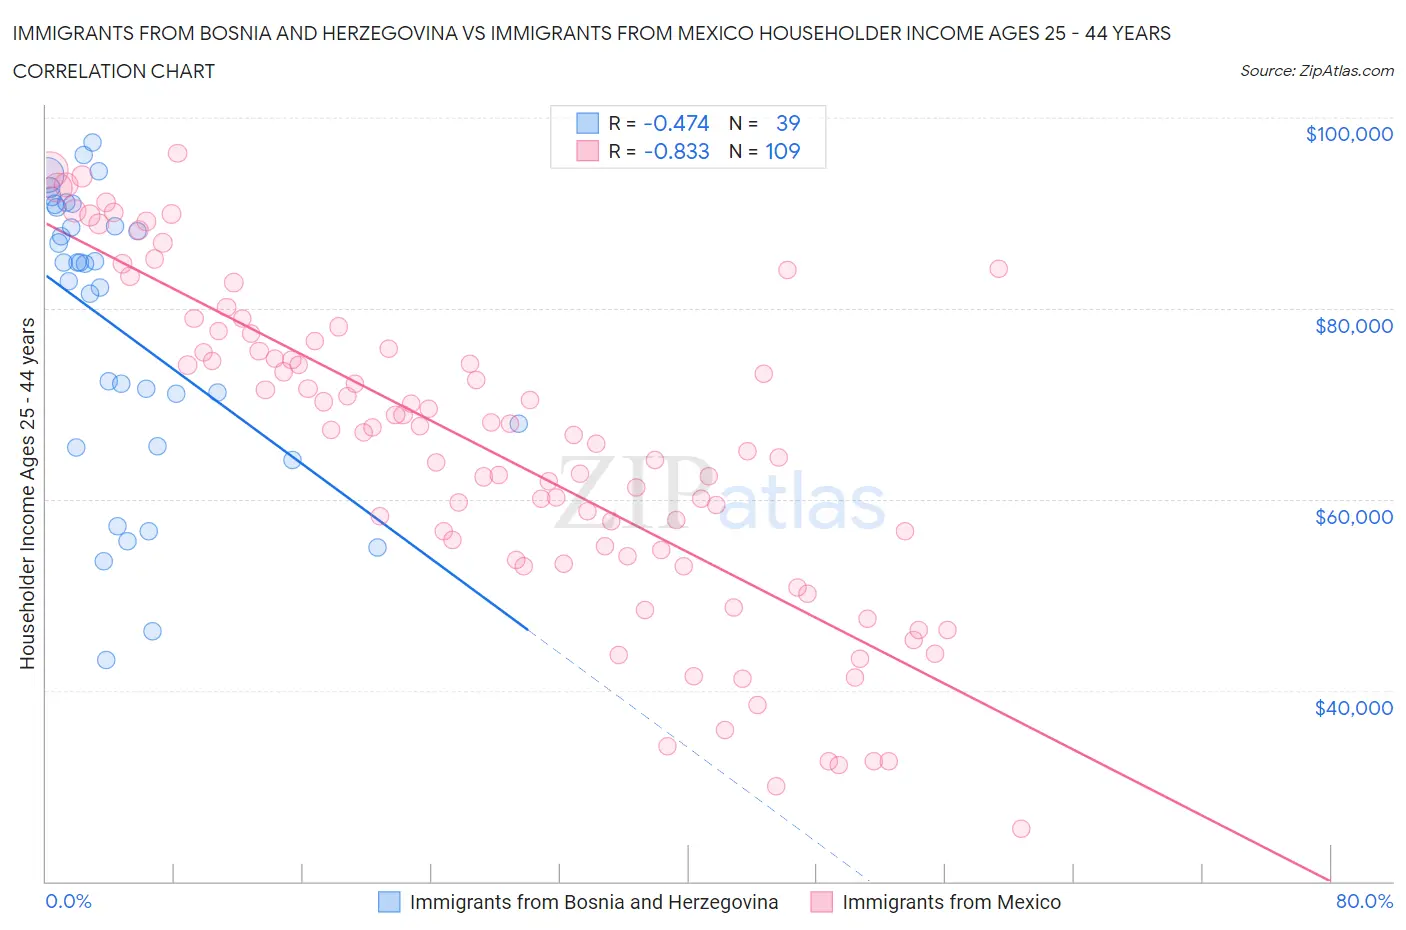
Immigrants from Bosnia and Herzegovina vs Immigrants from Mexico Householder Income Ages 25 - 44 years Correlation Chart
The statistical analysis conducted on geographies consisting of 156,745,458 people shows a moderate negative correlation between the proportion of Immigrants from Bosnia and Herzegovina and household income with householder between the ages 25 and 44 in the United States with a correlation coefficient (R) of -0.474 and weighted average of $88,819. Similarly, the statistical analysis conducted on geographies consisting of 510,586,481 people shows a very strong negative correlation between the proportion of Immigrants from Mexico and household income with householder between the ages 25 and 44 in the United States with a correlation coefficient (R) of -0.833 and weighted average of $78,809, a difference of 12.7%.
Householder Income Ages 25 - 44 years Correlation Summary
| Measurement | Immigrants from Bosnia and Herzegovina | Immigrants from Mexico |
| Minimum | $43,125 | $25,500 |
| Maximum | $97,331 | $96,265 |
| Range | $54,206 | $70,765 |
| Mean | $77,653 | $65,144 |
| Median | $84,682 | $66,989 |
| Interquartile 25% (IQ1) | $65,598 | $53,834 |
| Interquartile 75% (IQ3) | $90,547 | $76,158 |
| Interquartile Range (IQR) | $24,949 | $22,324 |
| Standard Deviation (Sample) | $15,061 | $16,884 |
| Standard Deviation (Population) | $14,867 | $16,806 |
Similar Demographics by Householder Income Ages 25 - 44 years
Demographics Similar to Immigrants from Bosnia and Herzegovina by Householder Income Ages 25 - 44 years
In terms of householder income ages 25 - 44 years, the demographic groups most similar to Immigrants from Bosnia and Herzegovina are Immigrants from St. Vincent and the Grenadines ($88,888, a difference of 0.080%), Immigrants from Barbados ($88,687, a difference of 0.15%), Alaskan Athabascan ($88,446, a difference of 0.42%), Immigrants from Grenada ($88,311, a difference of 0.58%), and Nonimmigrants ($88,301, a difference of 0.59%).
| Demographics | Rating | Rank | Householder Income Ages 25 - 44 years |
| Immigrants | Trinidad and Tobago | 6.5 /100 | #221 | Tragic $89,748 |
| Immigrants | Ecuador | 6.2 /100 | #222 | Tragic $89,673 |
| Immigrants | Guyana | 5.9 /100 | #223 | Tragic $89,586 |
| Barbadians | 5.9 /100 | #224 | Tragic $89,565 |
| Immigrants | Panama | 5.5 /100 | #225 | Tragic $89,451 |
| Immigrants | Iraq | 5.5 /100 | #226 | Tragic $89,444 |
| Immigrants | St. Vincent and the Grenadines | 4.1 /100 | #227 | Tragic $88,888 |
| Immigrants | Bosnia and Herzegovina | 4.0 /100 | #228 | Tragic $88,819 |
| Immigrants | Barbados | 3.7 /100 | #229 | Tragic $88,687 |
| Alaskan Athabascans | 3.3 /100 | #230 | Tragic $88,446 |
| Immigrants | Grenada | 3.0 /100 | #231 | Tragic $88,311 |
| Immigrants | Nonimmigrants | 3.0 /100 | #232 | Tragic $88,301 |
| Malaysians | 3.0 /100 | #233 | Tragic $88,291 |
| Venezuelans | 2.9 /100 | #234 | Tragic $88,232 |
| Bermudans | 2.9 /100 | #235 | Tragic $88,231 |
Demographics Similar to Immigrants from Mexico by Householder Income Ages 25 - 44 years
In terms of householder income ages 25 - 44 years, the demographic groups most similar to Immigrants from Mexico are U.S. Virgin Islander ($78,911, a difference of 0.13%), African ($78,986, a difference of 0.22%), Ottawa ($79,012, a difference of 0.26%), Honduran ($78,540, a difference of 0.34%), and Cheyenne ($79,152, a difference of 0.44%).
| Demographics | Rating | Rank | Householder Income Ages 25 - 44 years |
| Indonesians | 0.0 /100 | #311 | Tragic $79,543 |
| Immigrants | Haiti | 0.0 /100 | #312 | Tragic $79,391 |
| Menominee | 0.0 /100 | #313 | Tragic $79,358 |
| Cheyenne | 0.0 /100 | #314 | Tragic $79,152 |
| Ottawa | 0.0 /100 | #315 | Tragic $79,012 |
| Africans | 0.0 /100 | #316 | Tragic $78,986 |
| U.S. Virgin Islanders | 0.0 /100 | #317 | Tragic $78,911 |
| Immigrants | Mexico | 0.0 /100 | #318 | Tragic $78,809 |
| Hondurans | 0.0 /100 | #319 | Tragic $78,540 |
| Choctaw | 0.0 /100 | #320 | Tragic $78,168 |
| Immigrants | Zaire | 0.0 /100 | #321 | Tragic $78,045 |
| Chickasaw | 0.0 /100 | #322 | Tragic $77,929 |
| Immigrants | Honduras | 0.0 /100 | #323 | Tragic $77,328 |
| Dutch West Indians | 0.0 /100 | #324 | Tragic $77,260 |
| Sioux | 0.0 /100 | #325 | Tragic $77,089 |