Immigrants from Bosnia and Herzegovina vs Northern European Householder Income Ages 25 - 44 years
COMPARE
Immigrants from Bosnia and Herzegovina
Northern European
Householder Income Ages 25 - 44 years
Householder Income Ages 25 - 44 years Comparison
Immigrants from Bosnia and Herzegovina
Northern Europeans
$88,819
HOUSEHOLDER INCOME AGES 25 - 44 YEARS
4.0/ 100
METRIC RATING
228th/ 347
METRIC RANK
$100,457
HOUSEHOLDER INCOME AGES 25 - 44 YEARS
96.3/ 100
METRIC RATING
107th/ 347
METRIC RANK
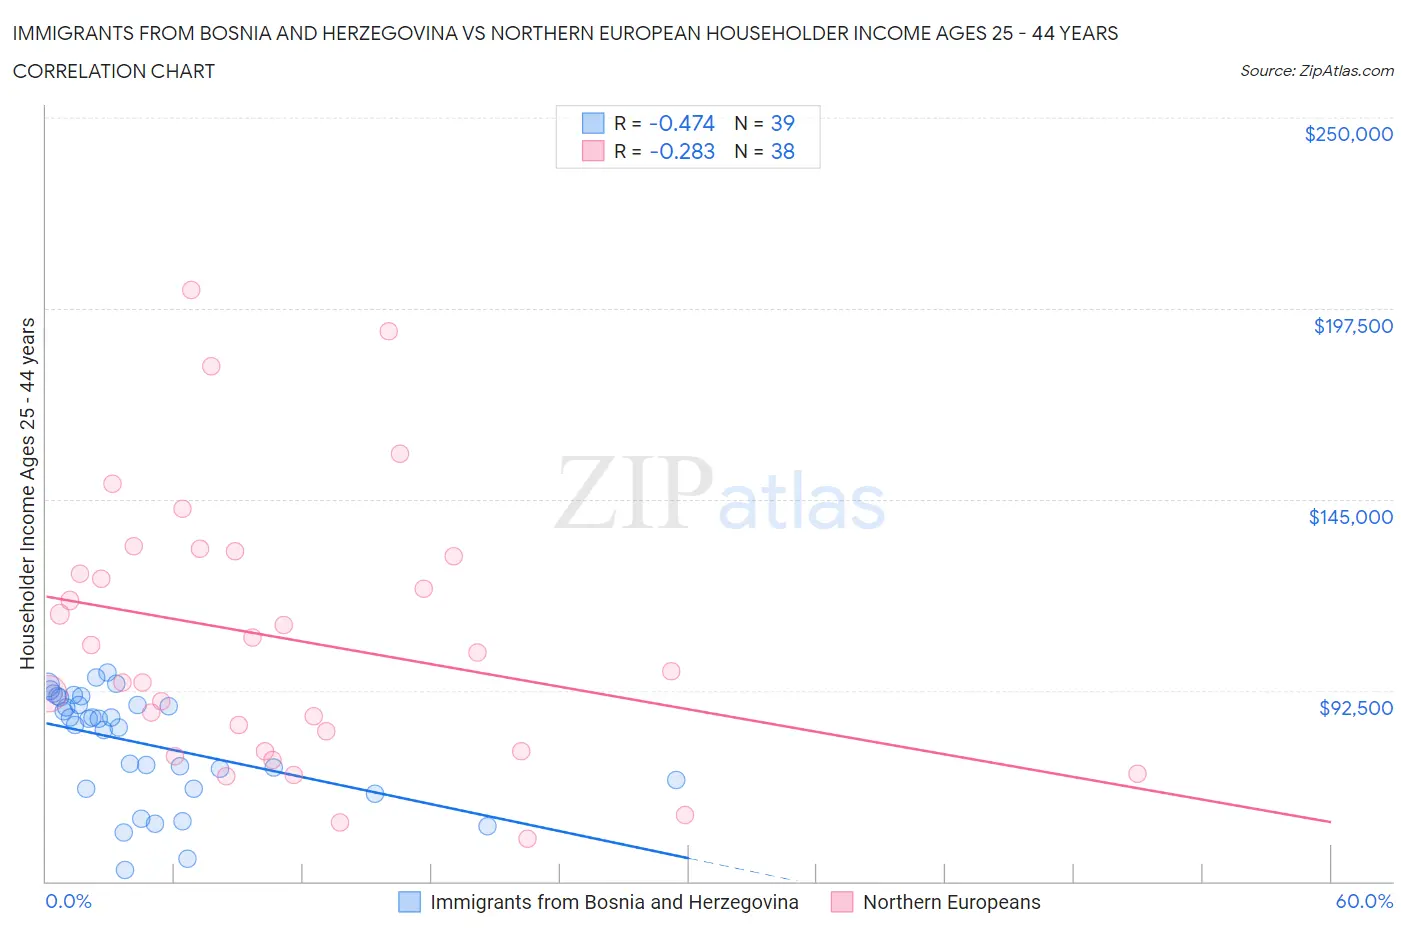
Immigrants from Bosnia and Herzegovina vs Northern European Householder Income Ages 25 - 44 years Correlation Chart
The statistical analysis conducted on geographies consisting of 156,745,458 people shows a moderate negative correlation between the proportion of Immigrants from Bosnia and Herzegovina and household income with householder between the ages 25 and 44 in the United States with a correlation coefficient (R) of -0.474 and weighted average of $88,819. Similarly, the statistical analysis conducted on geographies consisting of 404,748,237 people shows a weak negative correlation between the proportion of Northern Europeans and household income with householder between the ages 25 and 44 in the United States with a correlation coefficient (R) of -0.283 and weighted average of $100,457, a difference of 13.1%.
Householder Income Ages 25 - 44 years Correlation Summary
| Measurement | Immigrants from Bosnia and Herzegovina | Northern European |
| Minimum | $43,125 | $51,817 |
| Maximum | $97,331 | $202,571 |
| Range | $54,206 | $150,754 |
| Mean | $77,653 | $106,570 |
| Median | $84,682 | $100,458 |
| Interquartile 25% (IQ1) | $65,598 | $75,848 |
| Interquartile 75% (IQ3) | $90,547 | $129,485 |
| Interquartile Range (IQR) | $24,949 | $53,637 |
| Standard Deviation (Sample) | $15,061 | $36,774 |
| Standard Deviation (Population) | $14,867 | $36,287 |
Similar Demographics by Householder Income Ages 25 - 44 years
Demographics Similar to Immigrants from Bosnia and Herzegovina by Householder Income Ages 25 - 44 years
In terms of householder income ages 25 - 44 years, the demographic groups most similar to Immigrants from Bosnia and Herzegovina are Immigrants from St. Vincent and the Grenadines ($88,888, a difference of 0.080%), Immigrants from Barbados ($88,687, a difference of 0.15%), Alaskan Athabascan ($88,446, a difference of 0.42%), Immigrants from Grenada ($88,311, a difference of 0.58%), and Nonimmigrants ($88,301, a difference of 0.59%).
| Demographics | Rating | Rank | Householder Income Ages 25 - 44 years |
| Immigrants | Trinidad and Tobago | 6.5 /100 | #221 | Tragic $89,748 |
| Immigrants | Ecuador | 6.2 /100 | #222 | Tragic $89,673 |
| Immigrants | Guyana | 5.9 /100 | #223 | Tragic $89,586 |
| Barbadians | 5.9 /100 | #224 | Tragic $89,565 |
| Immigrants | Panama | 5.5 /100 | #225 | Tragic $89,451 |
| Immigrants | Iraq | 5.5 /100 | #226 | Tragic $89,444 |
| Immigrants | St. Vincent and the Grenadines | 4.1 /100 | #227 | Tragic $88,888 |
| Immigrants | Bosnia and Herzegovina | 4.0 /100 | #228 | Tragic $88,819 |
| Immigrants | Barbados | 3.7 /100 | #229 | Tragic $88,687 |
| Alaskan Athabascans | 3.3 /100 | #230 | Tragic $88,446 |
| Immigrants | Grenada | 3.0 /100 | #231 | Tragic $88,311 |
| Immigrants | Nonimmigrants | 3.0 /100 | #232 | Tragic $88,301 |
| Malaysians | 3.0 /100 | #233 | Tragic $88,291 |
| Venezuelans | 2.9 /100 | #234 | Tragic $88,232 |
| Bermudans | 2.9 /100 | #235 | Tragic $88,231 |
Demographics Similar to Northern Europeans by Householder Income Ages 25 - 44 years
In terms of householder income ages 25 - 44 years, the demographic groups most similar to Northern Europeans are Immigrants from Vietnam ($100,535, a difference of 0.080%), Immigrants from Brazil ($100,534, a difference of 0.080%), Immigrants from South Eastern Asia ($100,283, a difference of 0.17%), Immigrants from North Macedonia ($100,101, a difference of 0.36%), and Immigrants from Afghanistan ($99,977, a difference of 0.48%).
| Demographics | Rating | Rank | Householder Income Ages 25 - 44 years |
| Immigrants | Argentina | 97.8 /100 | #100 | Exceptional $101,415 |
| Albanians | 97.8 /100 | #101 | Exceptional $101,367 |
| Immigrants | Lebanon | 97.4 /100 | #102 | Exceptional $101,124 |
| Immigrants | Moldova | 97.4 /100 | #103 | Exceptional $101,091 |
| Immigrants | Poland | 97.4 /100 | #104 | Exceptional $101,065 |
| Immigrants | Vietnam | 96.5 /100 | #105 | Exceptional $100,535 |
| Immigrants | Brazil | 96.5 /100 | #106 | Exceptional $100,534 |
| Northern Europeans | 96.3 /100 | #107 | Exceptional $100,457 |
| Immigrants | South Eastern Asia | 96.0 /100 | #108 | Exceptional $100,283 |
| Immigrants | North Macedonia | 95.6 /100 | #109 | Exceptional $100,101 |
| Immigrants | Afghanistan | 95.3 /100 | #110 | Exceptional $99,977 |
| Chileans | 95.1 /100 | #111 | Exceptional $99,900 |
| Poles | 94.5 /100 | #112 | Exceptional $99,685 |
| Tongans | 94.2 /100 | #113 | Exceptional $99,604 |
| Immigrants | Western Asia | 94.0 /100 | #114 | Exceptional $99,516 |